
Bedding manufacturer Somnigroup (NYSE: SGI) reported Q3 CY2025 results topping the market’s revenue expectations, with sales up 63.3% year on year to $2.12 billion. Its non-GAAP profit of $0.95 per share was 10.7% above analysts’ consensus estimates.
Is now the time to buy Somnigroup? Find out by accessing our full research report, it’s free for active Edge members.
Somnigroup (SGI) Q3 CY2025 Highlights:
- Revenue: $2.12 billion vs analyst estimates of $2.06 billion (63.3% year-on-year growth, 3% beat)
- Adjusted EPS: $0.95 vs analyst estimates of $0.86 (10.7% beat)
- Adjusted EBITDA: $418.9 million vs analyst estimates of $395.6 million (19.7% margin, 5.9% beat)
- Management raised its full-year Adjusted EPS guidance to $2.68 at the midpoint, a 4.9% increase
- Operating Margin: 14.8%, in line with the same quarter last year
- Free Cash Flow Margin: 17%, down from 18.5% in the same quarter last year
- Market Capitalization: $16.71 billion
Company Chairman and CEO Scott Thompson commented, "We are pleased to report record sales, profits and operating cash flow in the third quarter, driven by strong operational execution across all of Somnigroup's business units, augmented by progress on our acquisition-related sales and cost synergy initiatives. This quarter's strong results were underpinned by slightly improving bedding industry trends. We are encouraged by our success this quarter and are well positioned to further leverage our leading manufacturing and retailing capabilities, trusted brands and broad omni-channel distribution footprint to capitalize on improvements across markets."
Company Overview
Established through the merger of Tempur-Pedic and Sealy in 2012, Somnigroup (NYSE: SGI) is a bedding manufacturer known for its innovative memory foam mattresses and sleep products
Revenue Growth
A company’s long-term sales performance is one signal of its overall quality. Even a bad business can shine for one or two quarters, but a top-tier one grows for years. Over the last five years, Somnigroup grew its sales at a 14.3% annual rate. Although this growth is acceptable on an absolute basis, it fell short of our standards for the consumer discretionary sector, which enjoys a number of secular tailwinds.
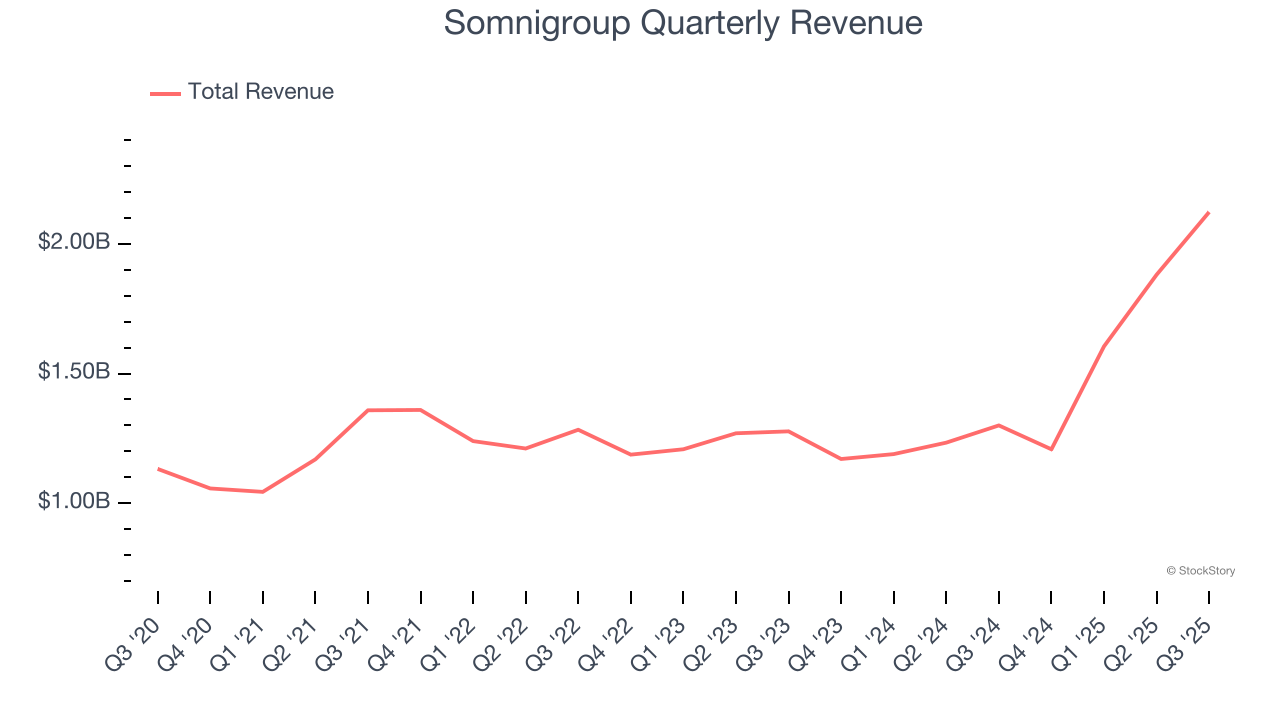
Long-term growth is the most important, but within consumer discretionary, product cycles are short and revenue can be hit-driven due to rapidly changing trends and consumer preferences. Somnigroup’s annualized revenue growth of 17.4% over the last two years is above its five-year trend, suggesting some bright spots. 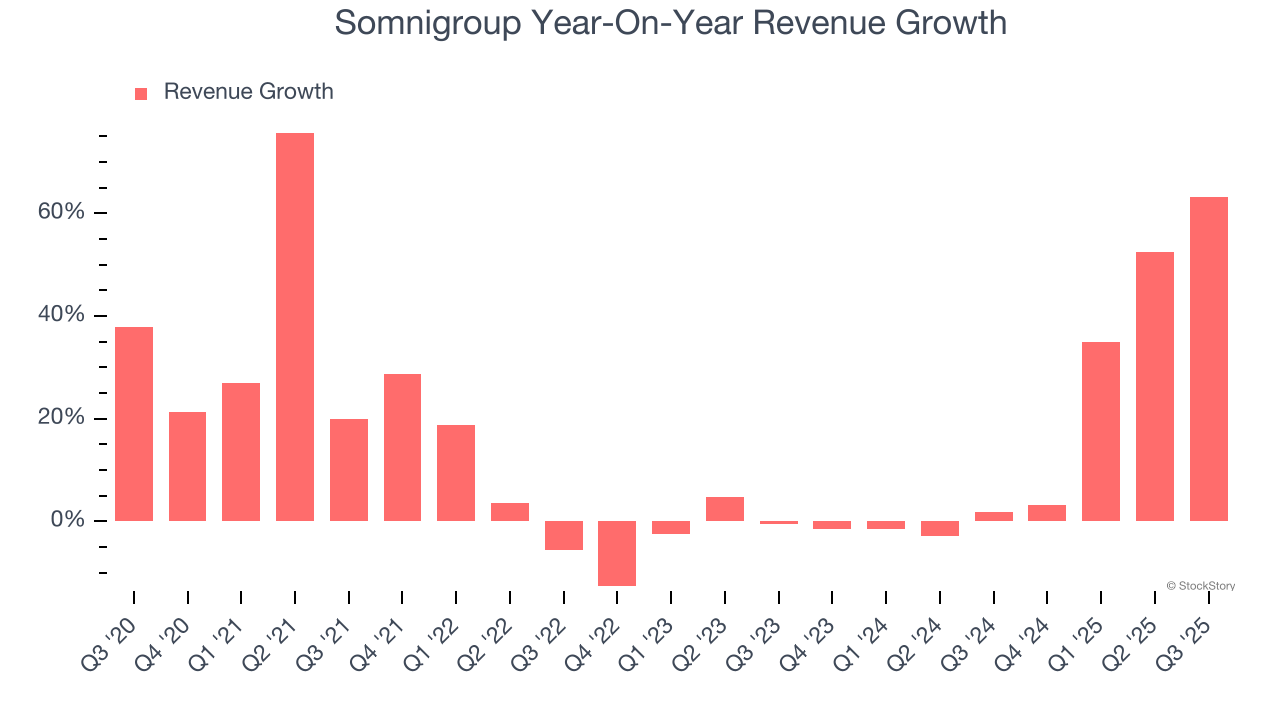
Somnigroup also breaks out the revenue for its most important segments, Wholesale and Direct, which are 34.8% and 65.2% of revenue. Over the last two years, Somnigroup’s Wholesale revenue (sales to retailers) averaged 9.6% year-on-year declines. On the other hand, its Direct revenue (sales made directly to consumers) averaged 59% growth. 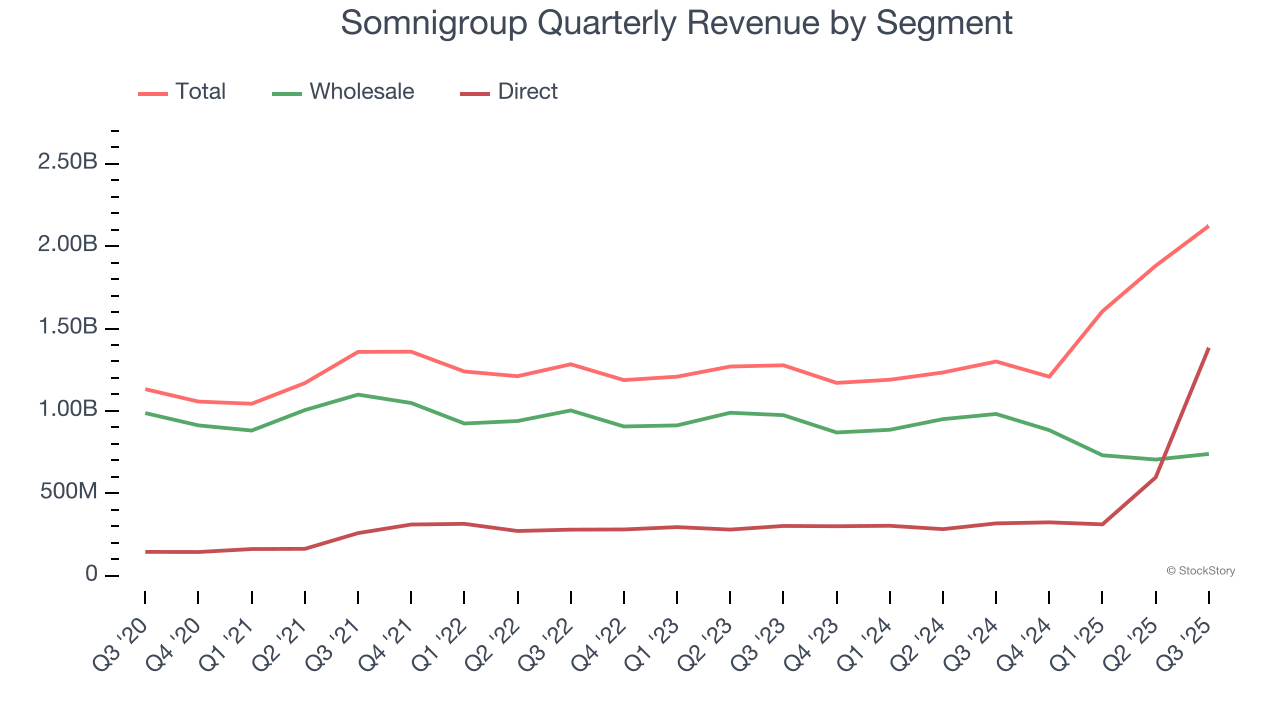
This quarter, Somnigroup reported magnificent year-on-year revenue growth of 63.3%, and its $2.12 billion of revenue beat Wall Street’s estimates by 3%.
Looking ahead, sell-side analysts expect revenue to grow 14.8% over the next 12 months, a slight deceleration versus the last two years. Still, this projection is above average for the sector and implies the market is baking in some success for its newer products and services.
The 1999 book Gorilla Game predicted Microsoft and Apple would dominate tech before it happened. Its thesis? Identify the platform winners early. Today, enterprise software companies embedding generative AI are becoming the new gorillas. a profitable, fast-growing enterprise software stock that is already riding the automation wave and looking to catch the generative AI next.
Operating Margin
Operating margin is an important measure of profitability as it shows the portion of revenue left after accounting for all core expenses – everything from the cost of goods sold to advertising and wages. It’s also useful for comparing profitability across companies with different levels of debt and tax rates because it excludes interest and taxes.
Somnigroup’s operating margin has shrunk over the last 12 months, but it still averaged 10.8% over the last two years, decent for a consumer discretionary business. This shows it generally does a decent job managing its expenses.
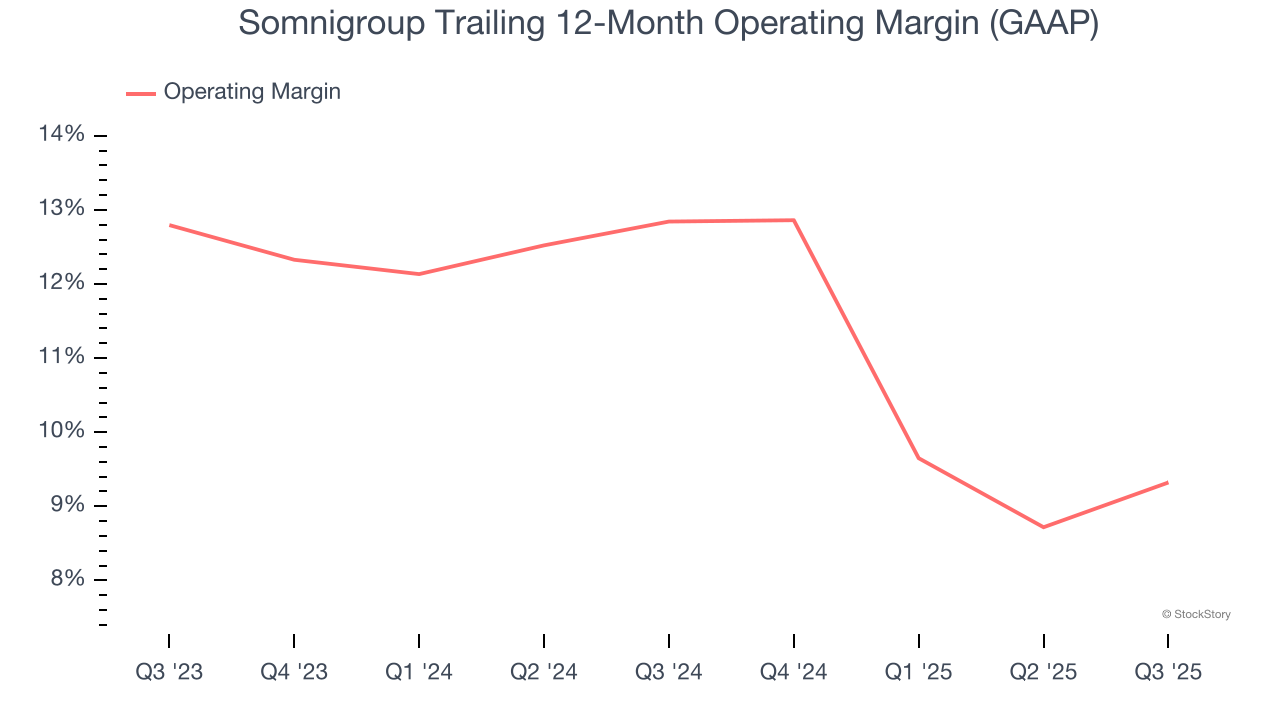
This quarter, Somnigroup generated an operating margin profit margin of 14.8%, in line with the same quarter last year. This indicates the company’s overall cost structure has been relatively stable.
Earnings Per Share
Revenue trends explain a company’s historical growth, but the long-term change in earnings per share (EPS) points to the profitability of that growth – for example, a company could inflate its sales through excessive spending on advertising and promotions.
Somnigroup’s EPS grew at a decent 10.2% compounded annual growth rate over the last five years. However, this performance was lower than its 14.3% annualized revenue growth, telling us the company became less profitable on a per-share basis as it expanded.
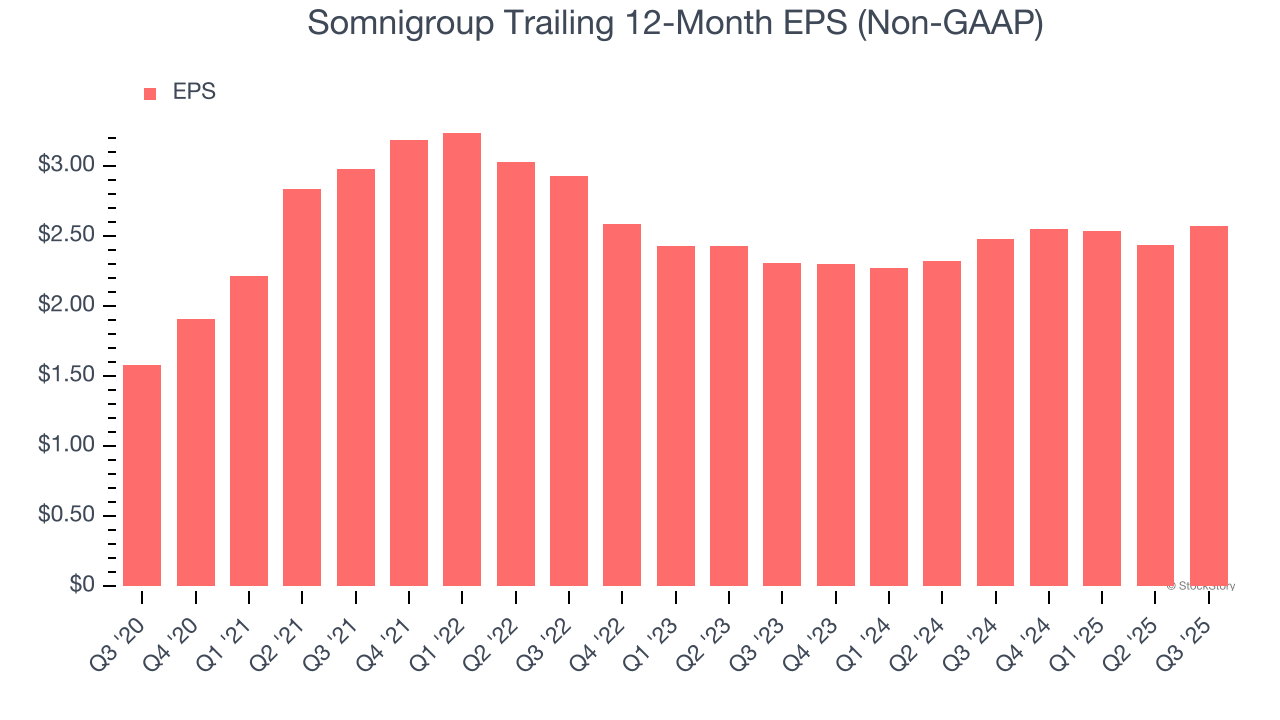
In Q3, Somnigroup reported adjusted EPS of $0.95, up from $0.82 in the same quarter last year. This print easily cleared analysts’ estimates, and shareholders should be content with the results. Over the next 12 months, Wall Street expects Somnigroup’s full-year EPS of $2.57 to grow 17.1%.
Key Takeaways from Somnigroup’s Q3 Results
We were impressed by how significantly Somnigroup blew past analysts’ Direct revenue expectations this quarter. We were also glad its full-year EPS guidance exceeded Wall Street’s estimates. On the other hand, its Wholesale revenue missed. Overall, we think this was a solid quarter with some key areas of upside. The stock traded up 1.8% to $81.03 immediately following the results.
Somnigroup put up rock-solid earnings, but one quarter doesn’t necessarily make the stock a buy. Let’s see if this is a good investment. If you’re making that decision, you should consider the bigger picture of valuation, business qualities, as well as the latest earnings. We cover that in our actionable full research report which you can read here, it’s free for active Edge members.