
Higher education company Strategic Education (NASDAQ: STRA) announced better-than-expected revenue in Q3 CY2025, with sales up 4.6% year on year to $319.9 million. Its non-GAAP profit of $1.64 per share was 25.8% above analysts’ consensus estimates.
Is now the time to buy Strategic Education? Find out by accessing our full research report, it’s free for active Edge members.
Strategic Education (STRA) Q3 CY2025 Highlights:
- Revenue: $319.9 million vs analyst estimates of $314.5 million (4.6% year-on-year growth, 1.7% beat)
- Adjusted EPS: $1.64 vs analyst estimates of $1.30 (25.8% beat)
- Adjusted EBITDA: $69.62 million vs analyst estimates of $61.1 million (21.8% margin, 13.9% beat)
- Operating Margin: 11.6%, in line with the same quarter last year
- Free Cash Flow Margin: 15.4%, up from 13.8% in the same quarter last year
- Domestic Students: 85,640, down 893 year on year
- Market Capitalization: $1.77 billion
Company Overview
Formed through the merger of Strayer Education and Capella Education in 2018, Strategic Education (NASDAQ: STRA) is a career-focused higher education provider.
Revenue Growth
A company’s long-term sales performance can indicate its overall quality. Any business can put up a good quarter or two, but the best consistently grow over the long haul. Regrettably, Strategic Education’s sales grew at a sluggish 4.2% compounded annual growth rate over the last five years. This fell short of our benchmark for the consumer discretionary sector and is a poor baseline for our analysis.
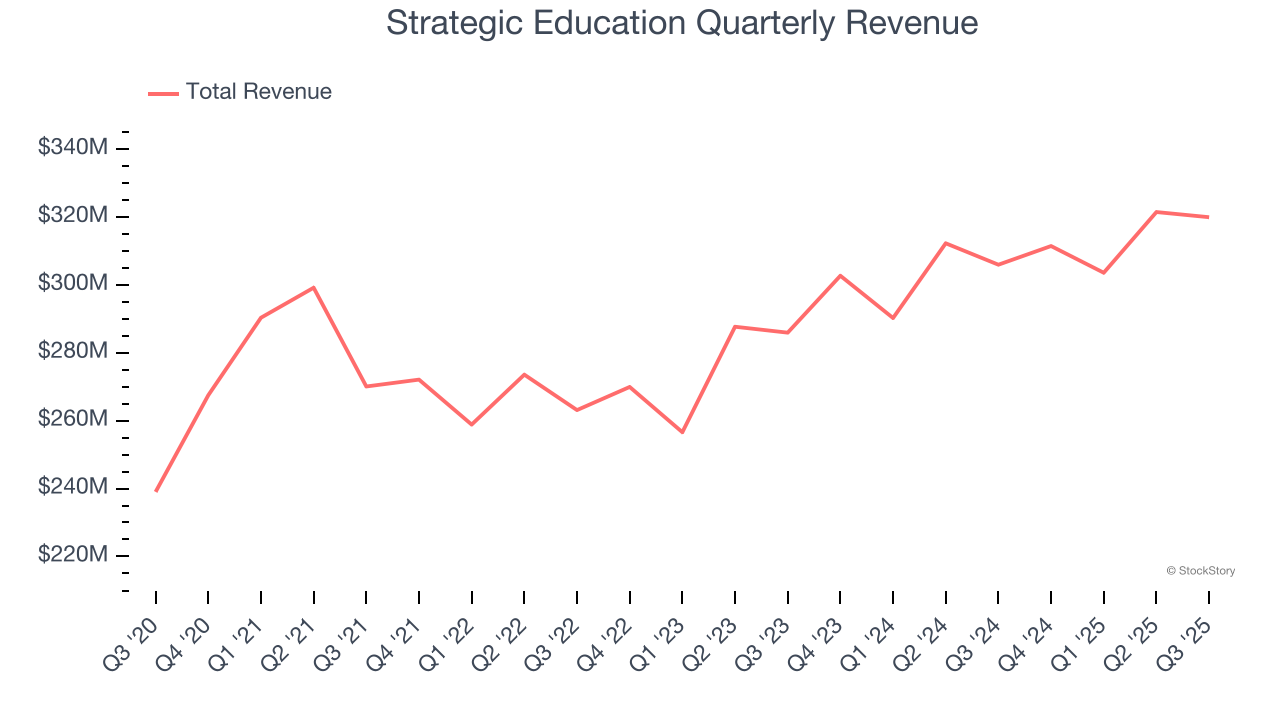
We at StockStory place the most emphasis on long-term growth, but within consumer discretionary, a stretched historical view may miss a company riding a successful new product or trend. Strategic Education’s annualized revenue growth of 6.9% over the last two years is above its five-year trend, but we were still disappointed by the results. 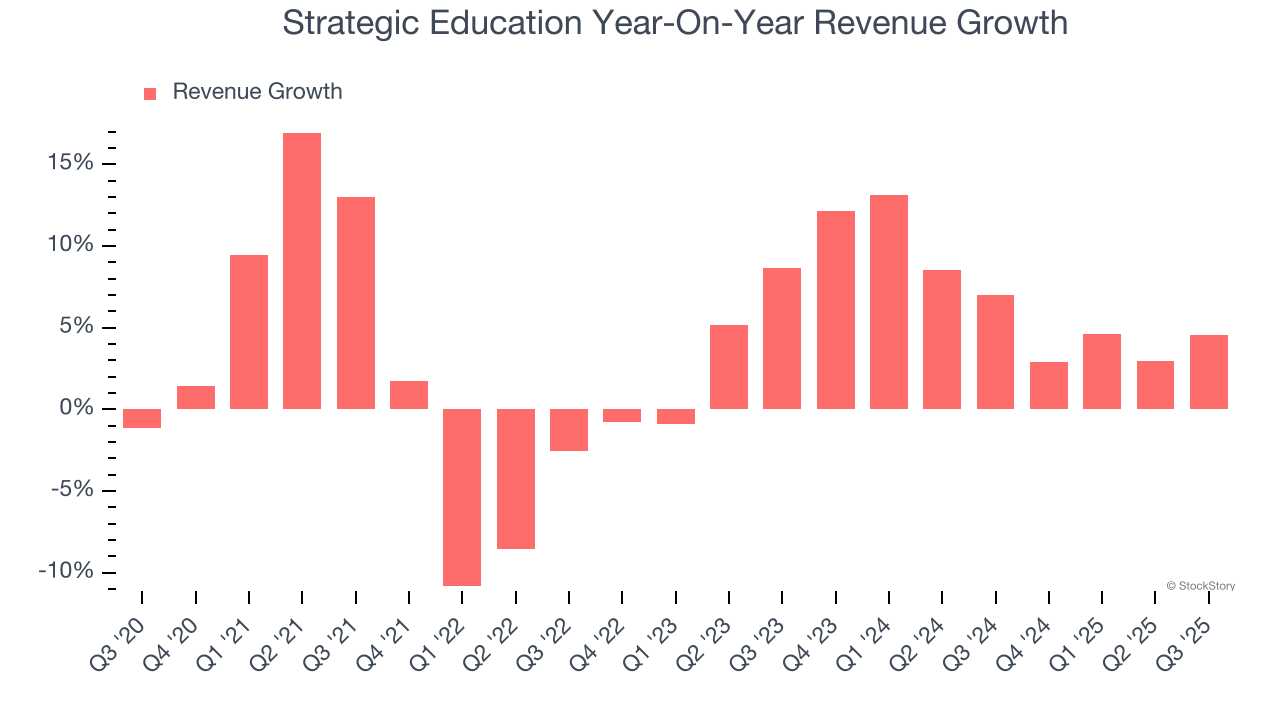
We can dig further into the company’s revenue dynamics by analyzing its number of domestic students and international students, which clocked in at 85,640 and 18,808 in the latest quarter. Over the last two years, Strategic Education’s domestic students averaged 4.3% year-on-year growth while its international students averaged 1.4% year-on-year growth. 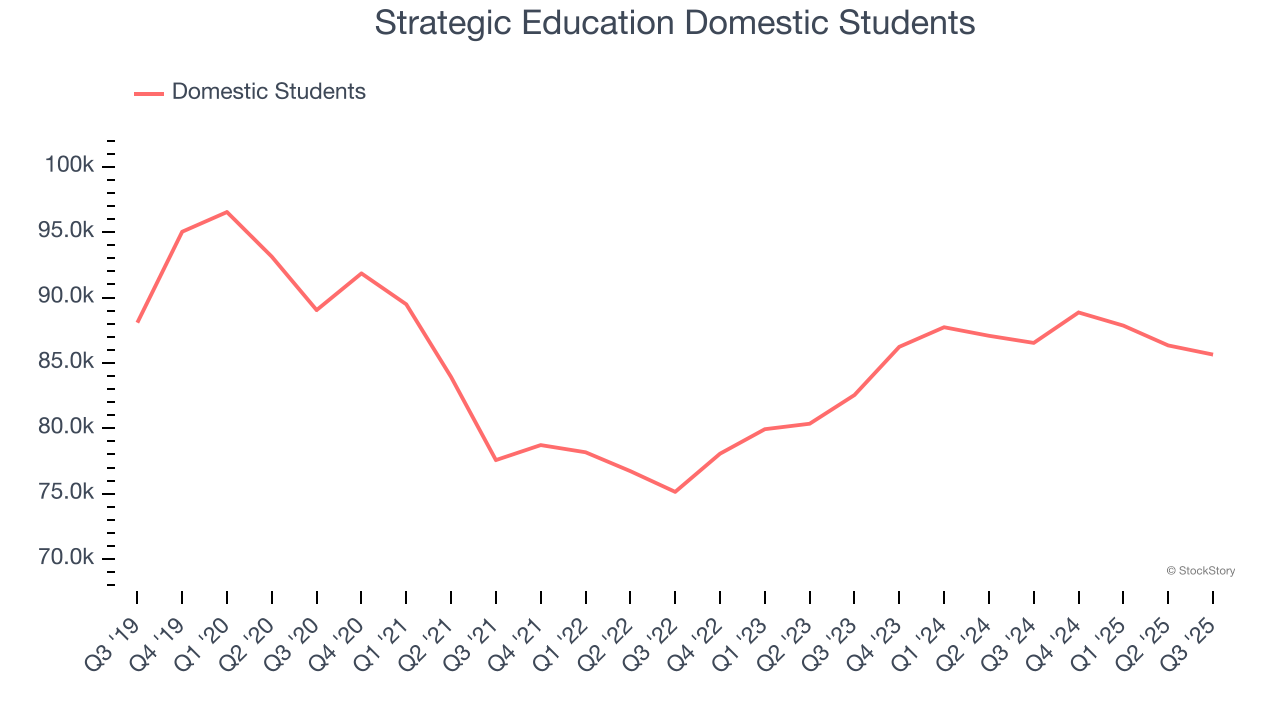
This quarter, Strategic Education reported modest year-on-year revenue growth of 4.6% but beat Wall Street’s estimates by 1.7%.
Looking ahead, sell-side analysts expect revenue to grow 2.8% over the next 12 months, a deceleration versus the last two years. This projection doesn't excite us and implies its products and services will face some demand challenges.
Microsoft, Alphabet, Coca-Cola, Monster Beverage—all began as under-the-radar growth stories riding a massive trend. We’ve identified the next one: a profitable AI semiconductor play Wall Street is still overlooking. Go here for access to our full report.
Operating Margin
Operating margin is an important measure of profitability as it shows the portion of revenue left after accounting for all core expenses – everything from the cost of goods sold to advertising and wages. It’s also useful for comparing profitability across companies with different levels of debt and tax rates because it excludes interest and taxes.
Strategic Education’s operating margin has been trending down over the last 12 months, but it still averaged 13.5% over the last two years, solid for a consumer discretionary business. This shows it generally manages its expenses well.
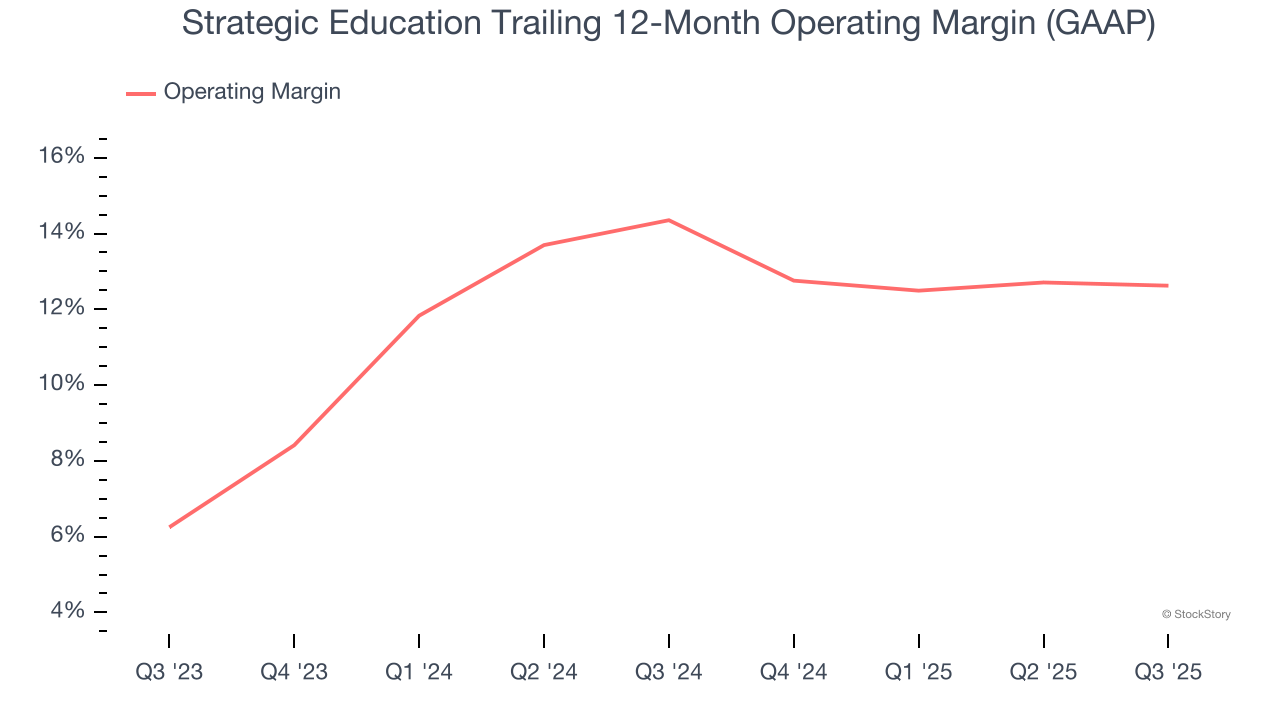
This quarter, Strategic Education generated an operating margin profit margin of 11.6%, in line with the same quarter last year. This indicates the company’s overall cost structure has been relatively stable.
Earnings Per Share
Revenue trends explain a company’s historical growth, but the long-term change in earnings per share (EPS) points to the profitability of that growth – for example, a company could inflate its sales through excessive spending on advertising and promotions.
Sadly for Strategic Education, its EPS declined by 5.2% annually over the last five years while its revenue grew by 4.2%. However, its operating margin actually improved during this time, telling us that non-fundamental factors such as interest expenses and taxes affected its ultimate earnings.
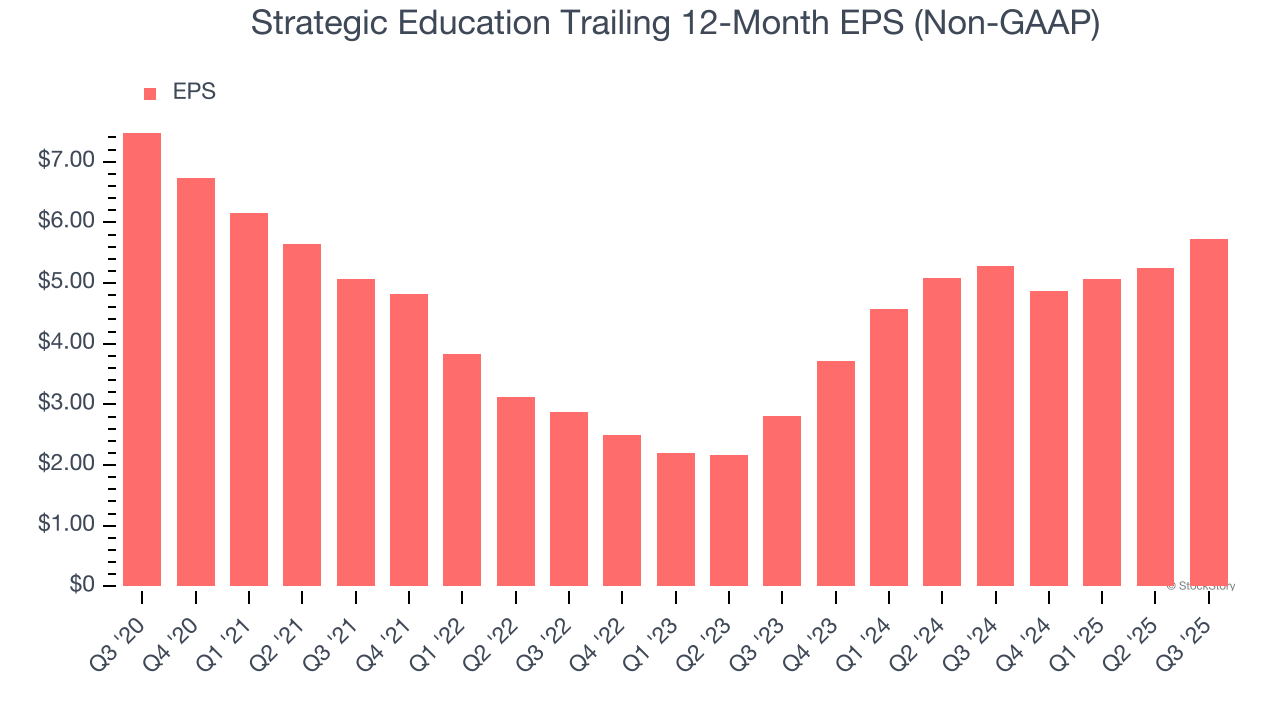
In Q3, Strategic Education reported adjusted EPS of $1.64, up from $1.16 in the same quarter last year. This print easily cleared analysts’ estimates, and shareholders should be content with the results. Over the next 12 months, Wall Street expects Strategic Education’s full-year EPS of $5.73 to grow 6.3%.
Key Takeaways from Strategic Education’s Q3 Results
It was good to see Strategic Education beat analysts’ EPS expectations this quarter. We were also glad its EBITDA outperformed Wall Street’s estimates. On the other hand, its number of domestic students missed. Zooming out, we think this quarter featured some important positives. The stock remained flat at $74.79 immediately after reporting.
Strategic Education may have had a good quarter, but does that mean you should invest right now? The latest quarter does matter, but not nearly as much as longer-term fundamentals and valuation, when deciding if the stock is a buy. We cover that in our actionable full research report which you can read here, it’s free for active Edge members.


