
Casual salad chain Sweetgreen (NYSE: SG) missed Wall Street’s revenue expectations in Q3 CY2025, with sales flat year on year at $172.4 million. The company’s full-year revenue guidance of $685 million at the midpoint came in 2.5% below analysts’ estimates. Its GAAP loss of $0.31 per share was 76.2% below analysts’ consensus estimates.
Is now the time to buy Sweetgreen? Find out by accessing our full research report, it’s free for active Edge members.
Sweetgreen (SG) Q3 CY2025 Highlights:
- Revenue: $172.4 million vs analyst estimates of $177.9 million (flat year on year, 3.1% miss)
- EPS (GAAP): -$0.31 vs analyst expectations of -$0.18 (76.2% miss)
- Adjusted EBITDA: -$4.36 million vs analyst estimates of $3.99 million (-2.5% margin, significant miss)
- The company dropped its revenue guidance for the full year to $685 million at the midpoint from $707.5 million, a 3.2% decrease
- EBITDA guidance for the full year is -$11.5 million at the midpoint, below analyst estimates of $10.65 million
- Operating Margin: -21%, down from -12.2% in the same quarter last year
- Same-Store Sales fell 9.5% year on year (6% in the same quarter last year)
- Market Capitalization: $764.8 million
Company Overview
Founded in 2007 by three Georgetown University alum, Sweetgreen (NYSE: SG) is a casual quick service chain known for its healthy salads and bowls.
Revenue Growth
A company’s long-term performance is an indicator of its overall quality. Any business can experience short-term success, but top-performing ones enjoy sustained growth for years.
With $685.2 million in revenue over the past 12 months, Sweetgreen is a small restaurant chain, which sometimes brings disadvantages compared to larger competitors benefiting from better brand awareness and economies of scale. On the bright side, it can grow faster because it has more white space to build new restaurants.
As you can see below, Sweetgreen’s sales grew at an excellent 17% compounded annual growth rate over the last six years (we compare to 2019 to normalize for COVID-19 impacts) as it opened new restaurants and increased sales at existing, established dining locations.
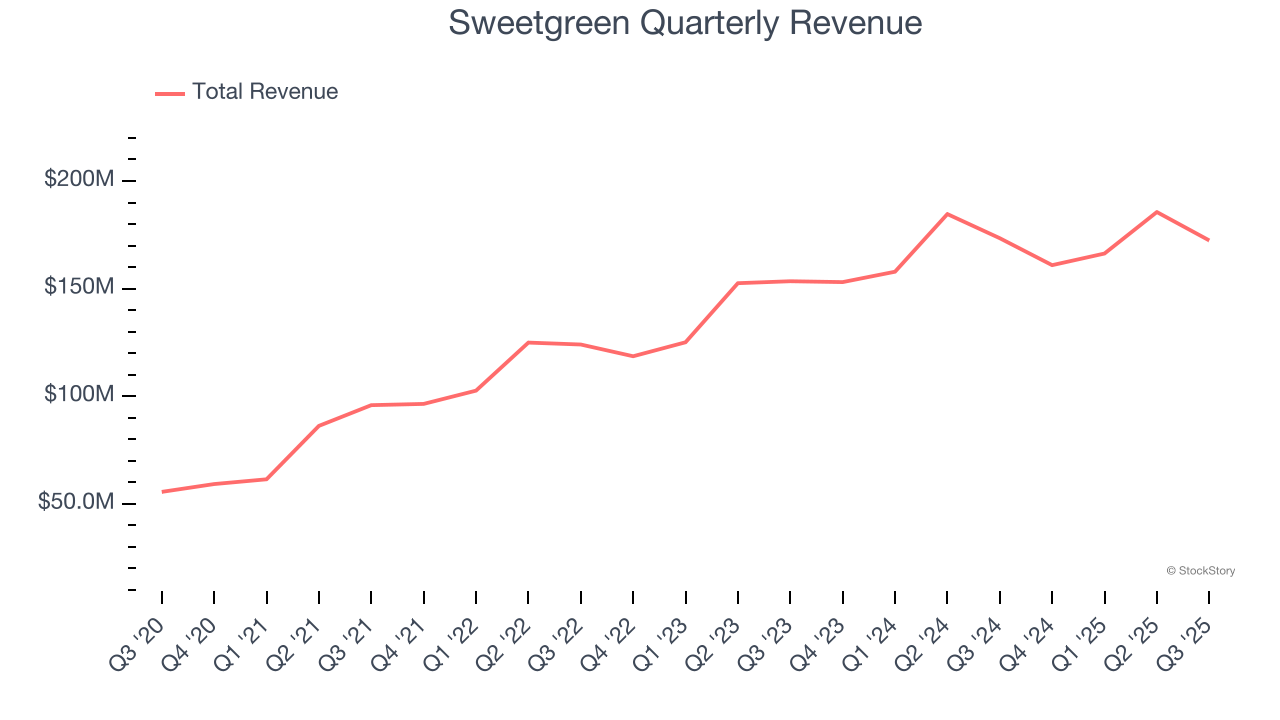
This quarter, Sweetgreen missed Wall Street’s estimates and reported a rather uninspiring 0.6% year-on-year revenue decline, generating $172.4 million of revenue.
Looking ahead, sell-side analysts expect revenue to grow 16% over the next 12 months, similar to its six-year rate. Despite the slowdown, this projection is commendable and indicates the market sees success for its menu offerings.
Software is eating the world and there is virtually no industry left that has been untouched by it. That drives increasing demand for tools helping software developers do their jobs, whether it be monitoring critical cloud infrastructure, integrating audio and video functionality, or ensuring smooth content streaming. Click here to access a free report on our 3 favorite stocks to play this generational megatrend.
Restaurant Performance
Number of Restaurants
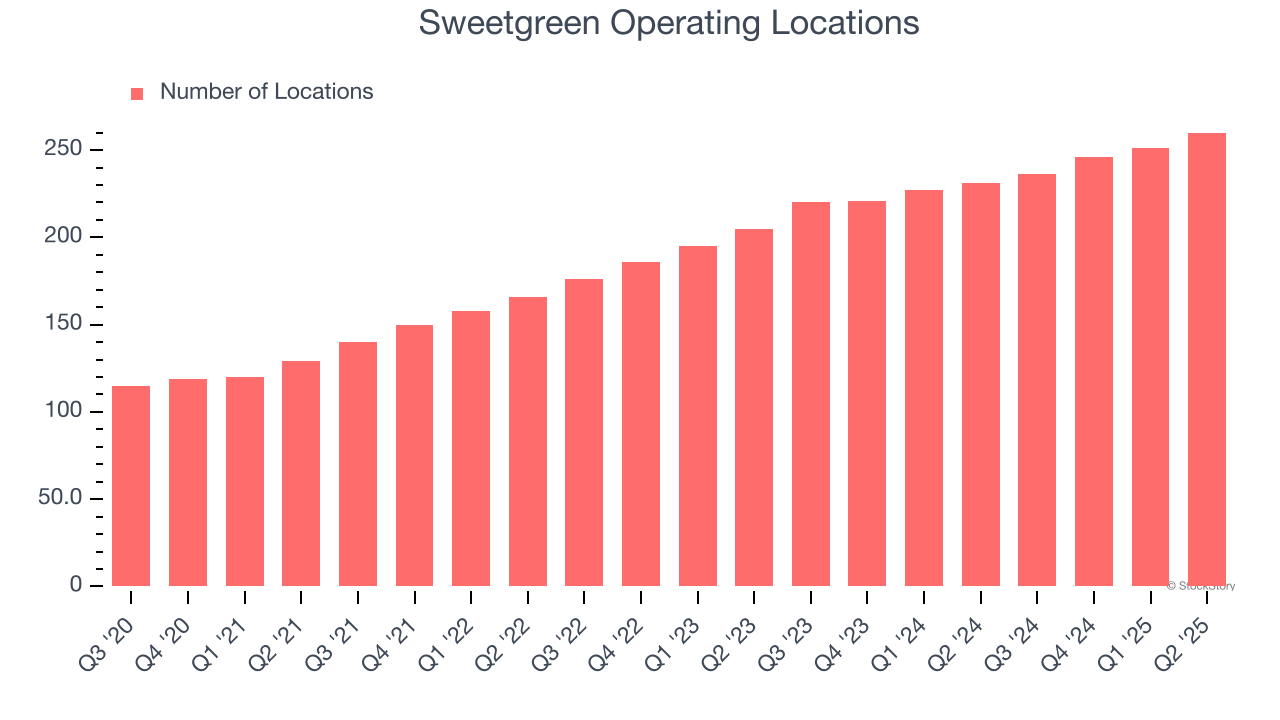
A restaurant chain’s total number of dining locations influences how much it can sell and how quickly revenue can grow.
Sweetgreen opened new restaurants at a rapid clip over the last two years, averaging 12.8% annual growth, much faster than the broader restaurant sector. This gives it a chance to scale into a mid-sized business over time.
When a chain opens new restaurants, it usually means it’s investing for growth because there’s healthy demand for its meals and there are markets where its concepts have few or no locations.
Note that Sweetgreen reports its restaurant count intermittently, so some data points are missing in the chart below.
Same-Store Sales
The change in a company's restaurant base only tells one side of the story. The other is the performance of its existing locations, which informs management teams whether they should expand or downsize their physical footprints. Same-store sales gives us insight into this topic because it measures organic growth at restaurants open for at least a year.
Sweetgreen’s demand within its existing dining locations has been relatively stable over the last two years but was below most restaurant chains. On average, the company’s same-store sales have grown by 1.2% per year. This performance suggests it should consider improving its foot traffic and efficiency before expanding its restaurant base.
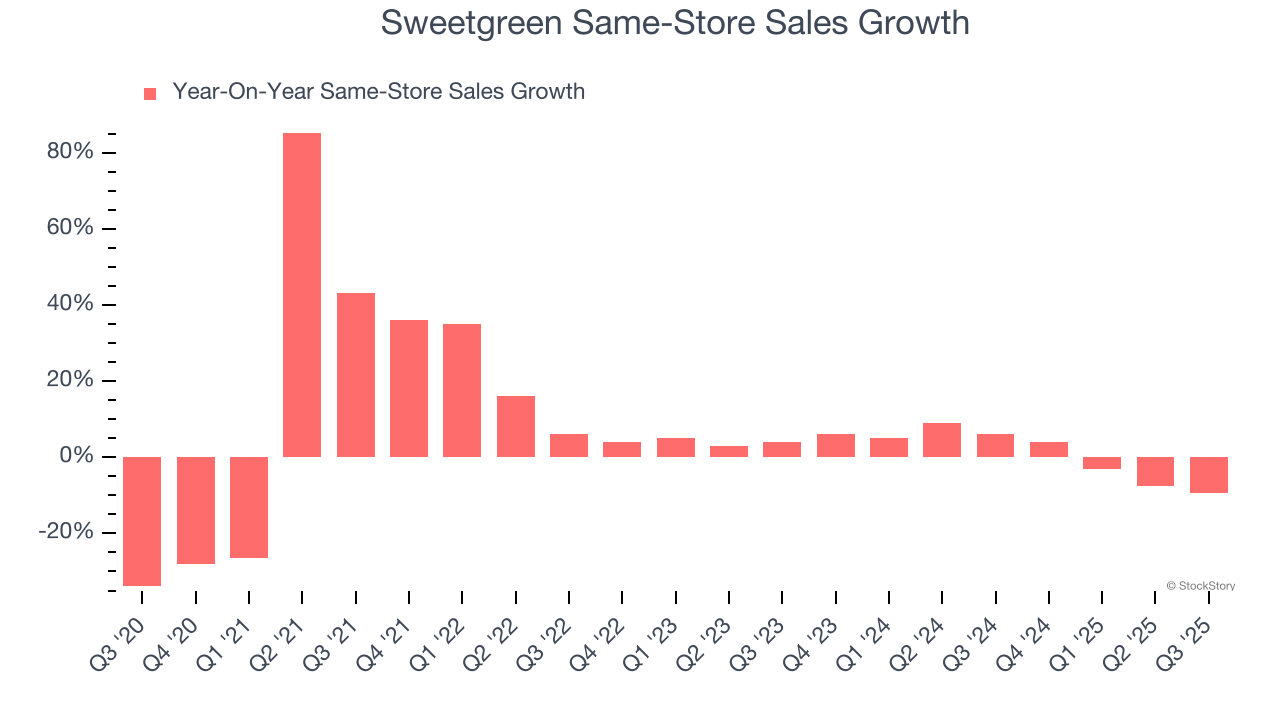
In the latest quarter, Sweetgreen’s same-store sales fell by 9.5% year on year. This decline was a reversal from its historical levels.
Key Takeaways from Sweetgreen’s Q3 Results
We struggled to find many positives in these results. Revenue missed on a big same-store sales decline. Its full-year revenue guidance missed and its full-year EBITDA guidance fell short of Wall Street’s estimates. Overall, this quarter could have been better. The stock traded down 7.4% to $5.79 immediately after reporting.
Sweetgreen’s earnings report left more to be desired. Let’s look forward to see if this quarter has created an opportunity to buy the stock. The latest quarter does matter, but not nearly as much as longer-term fundamentals and valuation, when deciding if the stock is a buy. We cover that in our actionable full research report which you can read here, it’s free for active Edge members.


