
Asana trades at $14.41 and has moved in lockstep with the market. Its shares have returned 9.6% over the last six months while the S&P 500 has gained 13%.
Is there a buying opportunity in Asana, or does it present a risk to your portfolio? See what our analysts have to say in our full research report, it’s free for active Edge members.
Why Do We Think Asana Will Underperform?
We're cautious about Asana. Here are three reasons there are better opportunities than ASAN and a stock we'd rather own.
1. Weak Billings Point to Soft Demand
Billings is a non-GAAP metric that is often called “cash revenue” because it shows how much money the company has collected from customers in a certain period. This is different from revenue, which must be recognized in pieces over the length of a contract.
Asana’s billings came in at $192.5 million in Q3, and over the last four quarters, its year-on-year growth averaged 9.3%. This performance was underwhelming and suggests that increasing competition is causing challenges in acquiring/retaining customers. 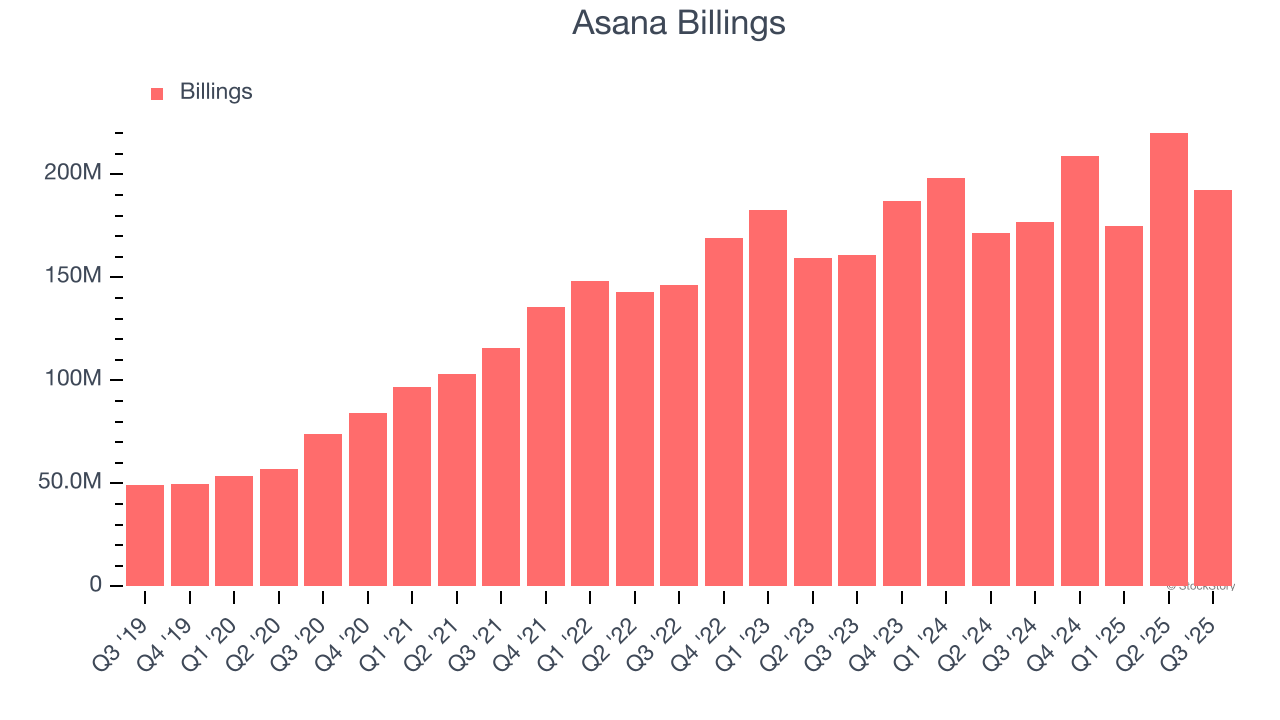
2. Customer Churn Hurts Long-Term Outlook
One of the best parts about the software-as-a-service business model (and a reason why they trade at high valuation multiples) is that customers typically spend more on a company’s products and services over time.
Asana’s net revenue retention rate, a key performance metric measuring how much money existing customers from a year ago are spending today, was 95.7% in Q3. This means Asana’s revenue would’ve decreased by 4.3% over the last 12 months if it didn’t win any new customers.
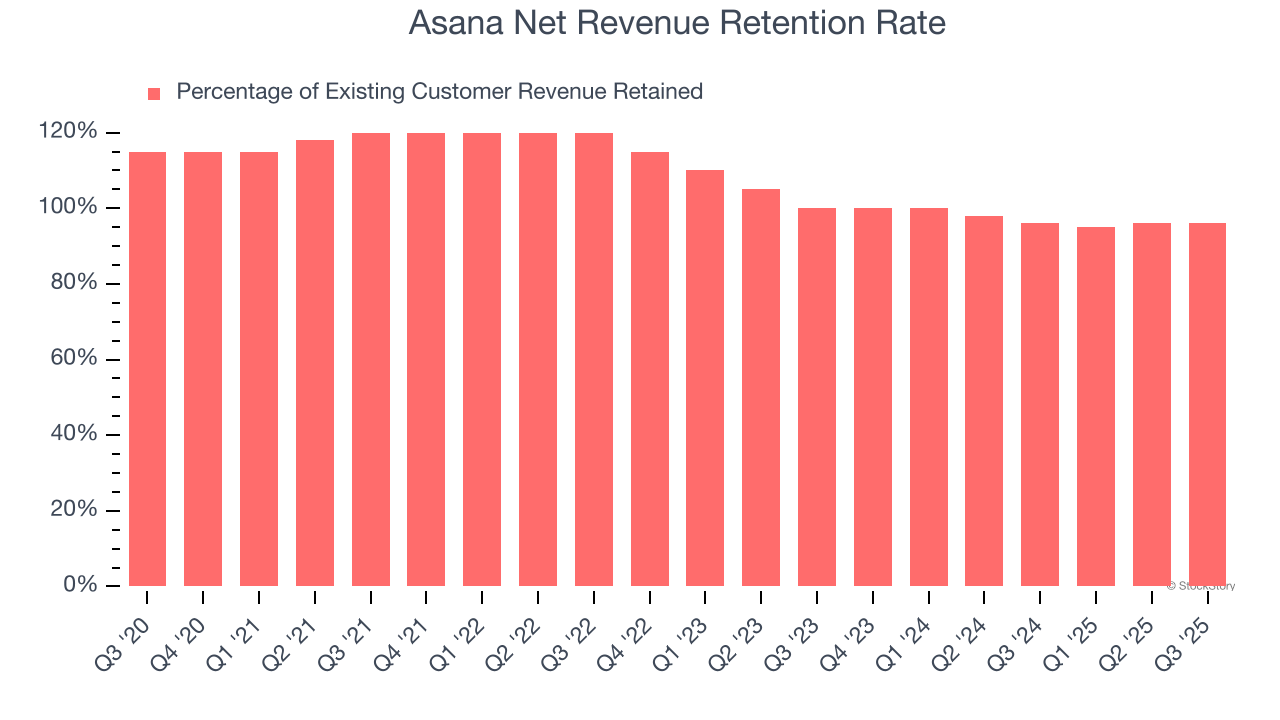
Asana has a weak net retention rate, signaling that some customers aren’t satisfied with its products, leading to lost contracts and revenue streams.
3. Long Payback Periods Delay Returns
The customer acquisition cost (CAC) payback period represents the months required to recover the cost of acquiring a new customer. Essentially, it’s the break-even point for sales and marketing investments. A shorter CAC payback period is ideal, as it implies better returns on investment and business scalability.
Asana’s recent customer acquisition efforts haven’t yielded returns as its CAC payback period was negative this quarter, meaning its incremental sales and marketing investments outpaced its revenue. This inefficiency partly stems from its focus on enterprise clients who require some degree of customization, resulting in long onboarding periods that delay customer spending.
Final Judgment
We cheer for all companies solving complex business issues, but in the case of Asana, we’ll be cheering from the sidelines. That said, the stock currently trades at 4.1× forward price-to-sales (or $14.41 per share). At this valuation, there’s a lot of good news priced in - we think there are better stocks to buy right now. We’d recommend looking at the most dominant software business in the world.
Stocks We Like More Than Asana
The market’s up big this year - but there’s a catch. Just 4 stocks account for half the S&P 500’s entire gain. That kind of concentration makes investors nervous, and for good reason. While everyone piles into the same crowded names, smart investors are hunting quality where no one’s looking - and paying a fraction of the price. Check out the high-quality names we’ve flagged in our Top 5 Strong Momentum Stocks for this week. This is a curated list of our High Quality stocks that have generated a market-beating return of 244% over the last five years (as of June 30, 2025).
Stocks that have made our list include now familiar names such as Nvidia (+1,326% between June 2020 and June 2025) as well as under-the-radar businesses like the once-micro-cap company Kadant (+351% five-year return). Find your next big winner with StockStory today.


