
What a time it’s been for Seagate Technology. In the past six months alone, the company’s stock price has increased by a massive 124%, reaching $293.81 per share. This was partly due to its solid quarterly results, and the performance may have investors wondering how to approach the situation.
Is it too late to buy STX? Find out in our full research report, it’s free for active Edge members.
Why Does STX Stock Spark Debate?
The developer of the original 5.25inch hard disk drive, Seagate (NASDAQ: STX) is a leading producer of data storage solutions, including hard drives and Solid State Drives (SSDs) used in PCs and data centers.
Two Positive Attributes:
1. Skyrocketing Revenue Shows Strong Momentum
We at StockStory place the most emphasis on long-term growth, but within semiconductors, a stretched historical view may miss new demand cycles or industry trends like AI. Seagate Technology’s annualized revenue growth of 18.5% over the last two years is above its five-year trend, suggesting its demand recently accelerated. 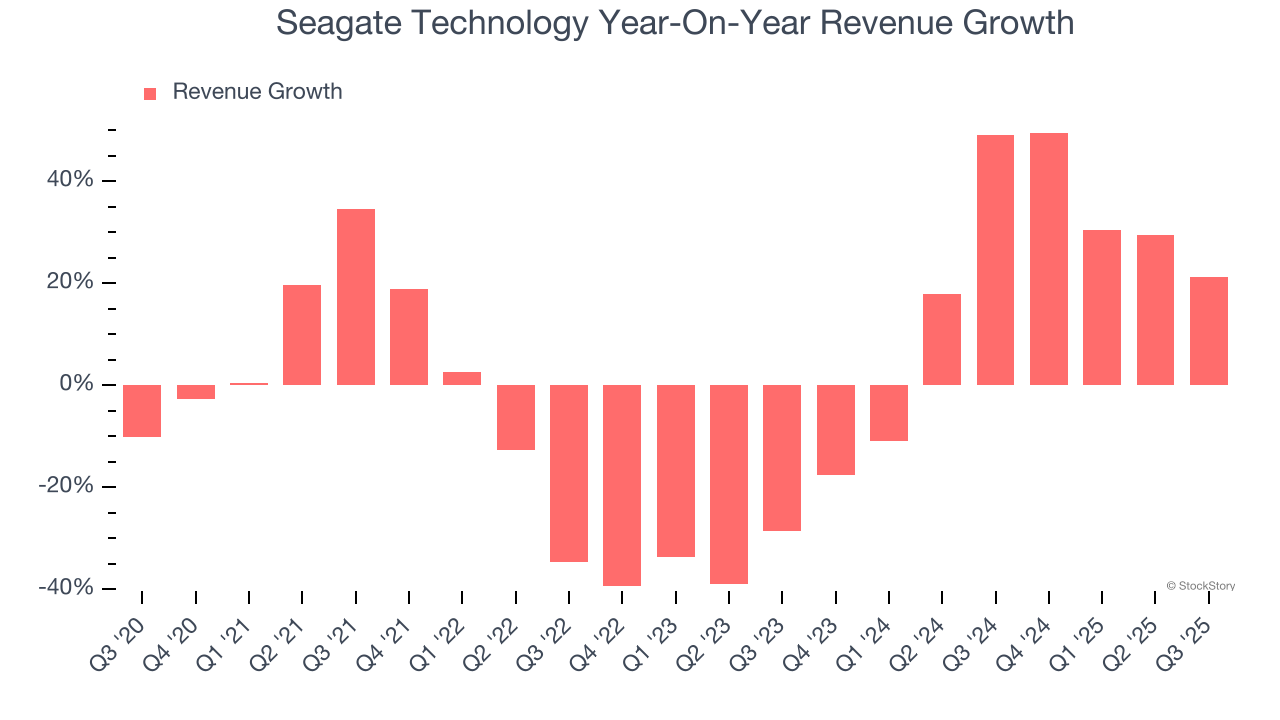
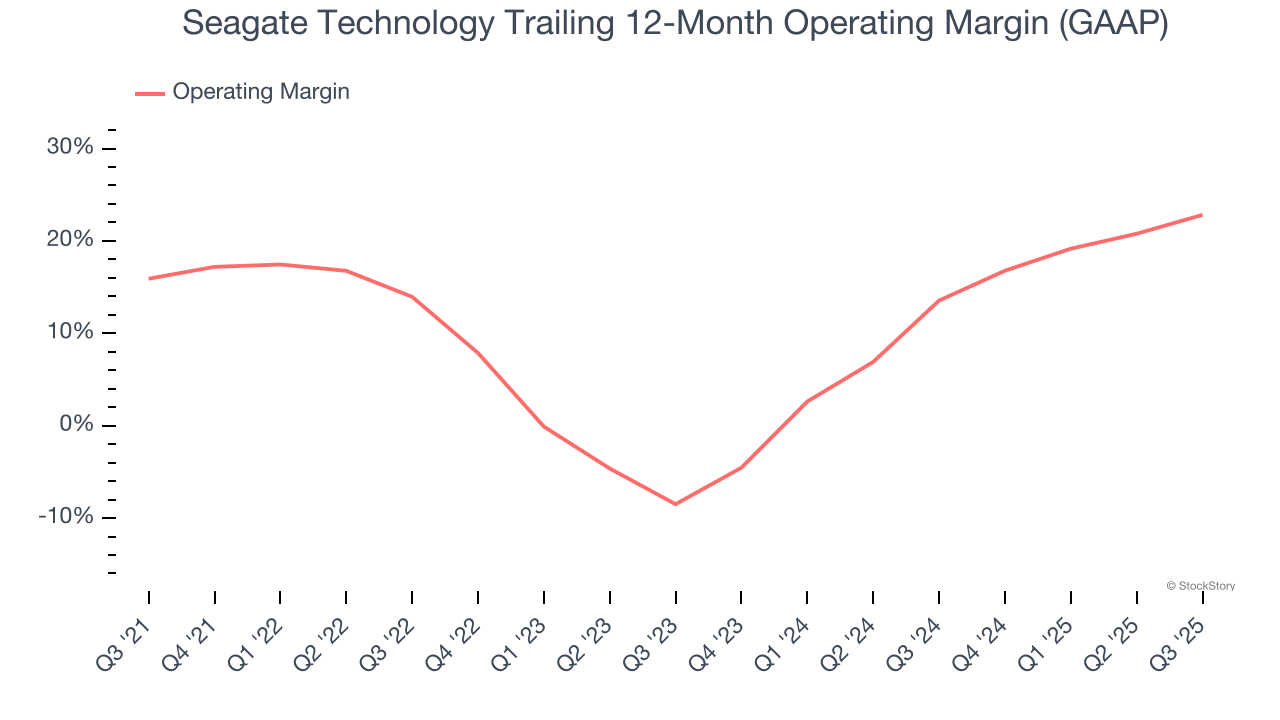
2. Operating Margin Rising, Profits Up
Operating margin is a key measure of profitability. Think of it as net income - the bottom line - excluding the impact of taxes and interest on debt, which are less connected to business fundamentals.
Looking at the trend in its profitability, Seagate Technology’s operating margin rose by 6.9 percentage points over the last five years, showing its efficiency has improved. . Its operating margin for the trailing 12 months was 22.8%.
One Reason to be Careful:
Low Gross Margin Reveals Weak Structural Profitability
In the semiconductor industry, a company’s gross profit margin is a critical metric to track because it sheds light on its pricing power, complexity of products, and ability to procure raw materials, equipment, and labor.
Seagate Technology’s gross margin is one of the worst in the semiconductor industry, signaling it operates in a competitive market and lacks pricing power. As you can see below, it averaged a 33.5% gross margin over the last two years. Said differently, Seagate Technology had to pay a chunky $66.49 to its suppliers for every $100 in revenue. 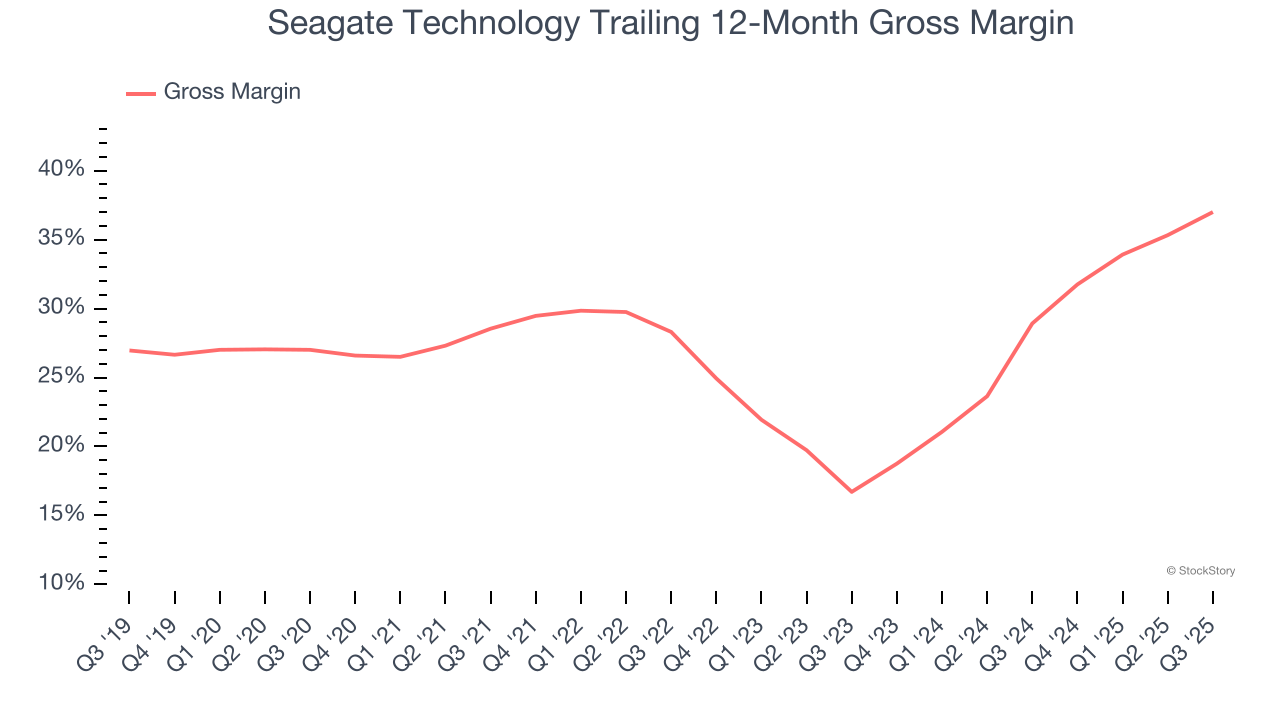
Final Judgment
Seagate Technology’s merits more than compensate for its flaws, and with the recent rally, the stock trades at 22.2× forward P/E (or $293.81 per share). Is now the time to initiate a position? See for yourself in our full research report, it’s free for active Edge members.
High-Quality Stocks for All Market Conditions
Your portfolio can’t afford to be based on yesterday’s story. The risk in a handful of heavily crowded stocks is rising daily.
The names generating the next wave of massive growth are right here in our Top 5 Strong Momentum Stocks for this week. This is a curated list of our High Quality stocks that have generated a market-beating return of 244% over the last five years (as of June 30, 2025).
Stocks that have made our list include now familiar names such as Nvidia (+1,326% between June 2020 and June 2025) as well as under-the-radar businesses like the once-micro-cap company Tecnoglass (+1,754% five-year return). Find your next big winner with StockStory today.


