
Work management platform Asana (NYSE: ASAN) announced better-than-expected revenue in Q3 CY2025, with sales up 9.3% year on year to $201 million. Guidance for next quarter’s revenue was better than expected at $205 million at the midpoint, 0.8% above analysts’ estimates. Its non-GAAP profit of $0.07 per share was in line with analysts’ consensus estimates.
Is now the time to buy Asana? Find out by accessing our full research report, it’s free for active Edge members.
Asana (ASAN) Q3 CY2025 Highlights:
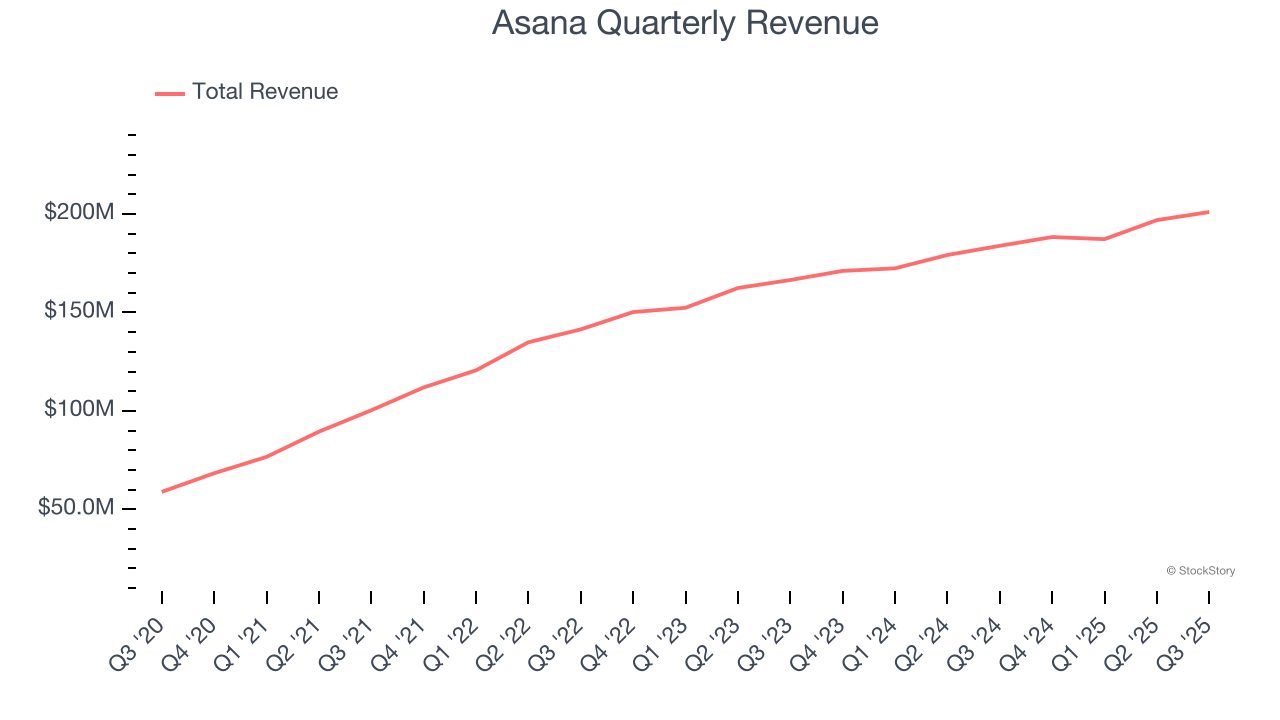
- Revenue: $201 million vs analyst estimates of $198.8 million (9.3% year-on-year growth, 1.1% beat)
- Adjusted EPS: $0.07 vs analyst estimates of $0.06 (in line)
- Adjusted Operating Income: $16.34 million vs analyst estimates of $13.28 million (8.1% margin, 23.1% beat)
- Revenue Guidance for Q4 CY2025 is $205 million at the midpoint, above analyst estimates of $203.3 million
- Management raised its full-year Adjusted EPS guidance to $0.26 at the midpoint, a 6.3% increase
- Operating Margin: -34.8%, down from -32.7% in the same quarter last year
- Free Cash Flow Margin: 6.7%, down from 18% in the previous quarter
- Customers: 25,413 customers paying more than $5,000 annually
- Net Revenue Retention Rate: 96%, in line with the previous quarter
- Billings: $192.5 million at quarter end, up 8.9% year on year
- Market Capitalization: $3.02 billion
Company Overview
Born from the founders' frustration with the inefficiencies of email-based collaboration at Facebook, Asana (NYSE: ASAN) provides a work management platform that helps organizations track projects, set goals, and manage workflows in a centralized digital workspace.
Revenue Growth
A company’s long-term sales performance is one signal of its overall quality. Any business can have short-term success, but a top-tier one grows for years. Over the last five years, Asana grew its sales at an impressive 30.8% compounded annual growth rate. Its growth beat the average software company and shows its offerings resonate with customers.
Long-term growth is the most important, but within software, a half-decade historical view may miss new innovations or demand cycles. Asana’s recent performance shows its demand has slowed significantly as its annualized revenue growth of 10.7% over the last two years was well below its five-year trend. 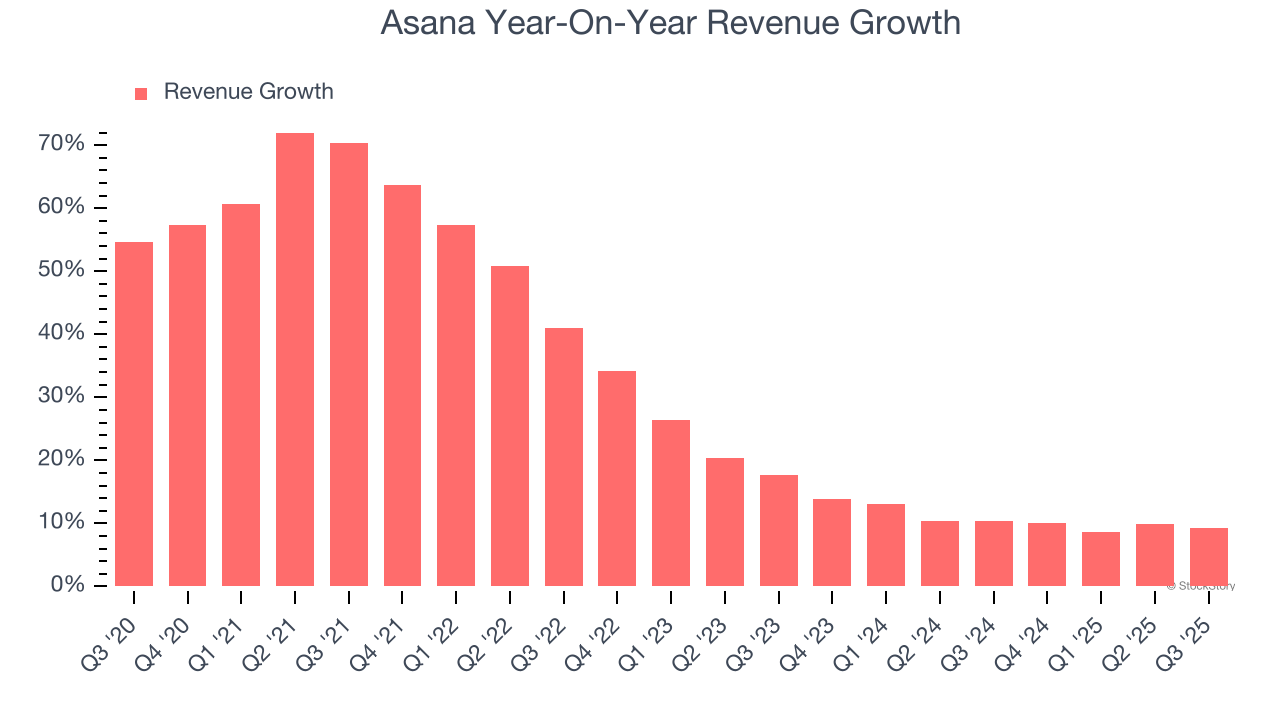
This quarter, Asana reported year-on-year revenue growth of 9.3%, and its $201 million of revenue exceeded Wall Street’s estimates by 1.1%. Company management is currently guiding for a 8.8% year-on-year increase in sales next quarter.
Looking further ahead, sell-side analysts expect revenue to grow 7.9% over the next 12 months, a slight deceleration versus the last two years. This projection doesn't excite us and indicates its products and services will see some demand headwinds.
While Wall Street chases Nvidia at all-time highs, an under-the-radar semiconductor supplier is dominating a critical AI component these giants can’t build without. Click here to access our free report one of our favorites growth stories.
Billings
Billings is a non-GAAP metric that is often called “cash revenue” because it shows how much money the company has collected from customers in a certain period. This is different from revenue, which must be recognized in pieces over the length of a contract.
Asana’s billings came in at $192.5 million in Q3, and over the last four quarters, its growth was underwhelming as it averaged 9.3% year-on-year increases. This performance mirrored its total sales and suggests that increasing competition is causing challenges in acquiring/retaining customers. 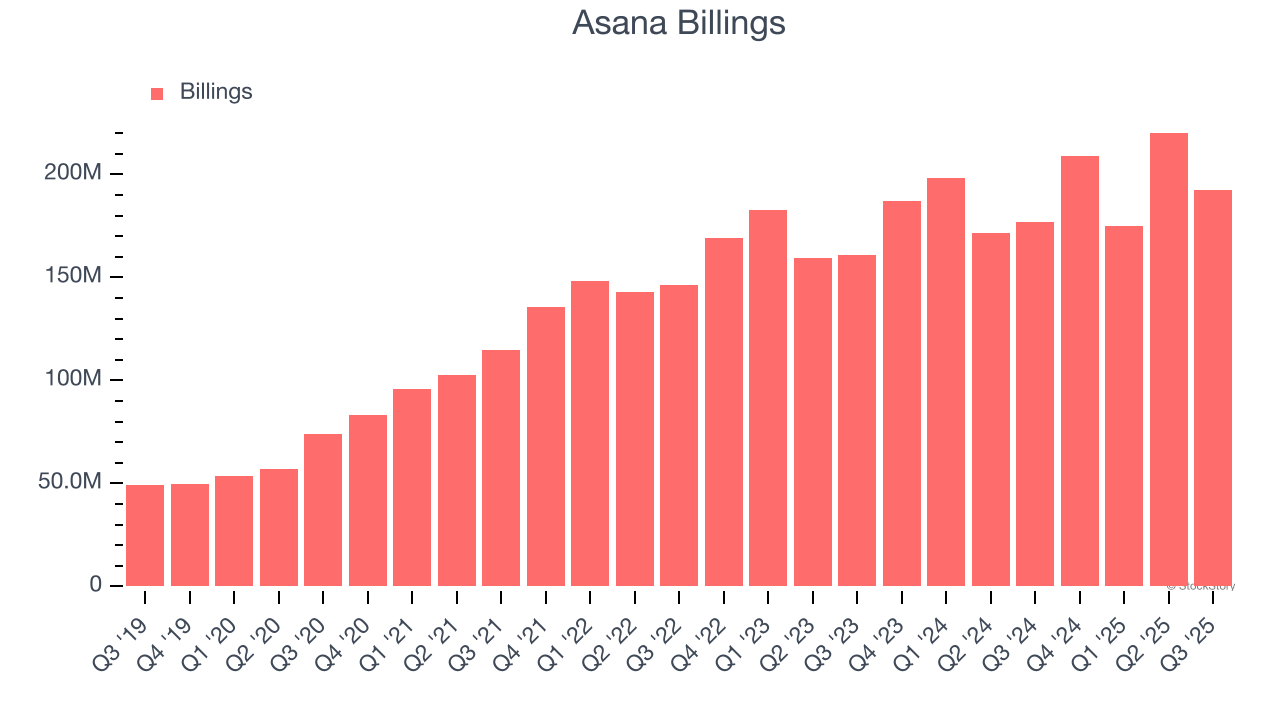
Customer Retention
One of the best parts about the software-as-a-service business model (and a reason why they trade at high valuation multiples) is that customers typically spend more on a company’s products and services over time.
Asana’s net revenue retention rate, a key performance metric measuring how much money existing customers from a year ago are spending today, was 95.7% in Q3. This means Asana’s revenue would’ve decreased by 4.3% over the last 12 months if it didn’t win any new customers.
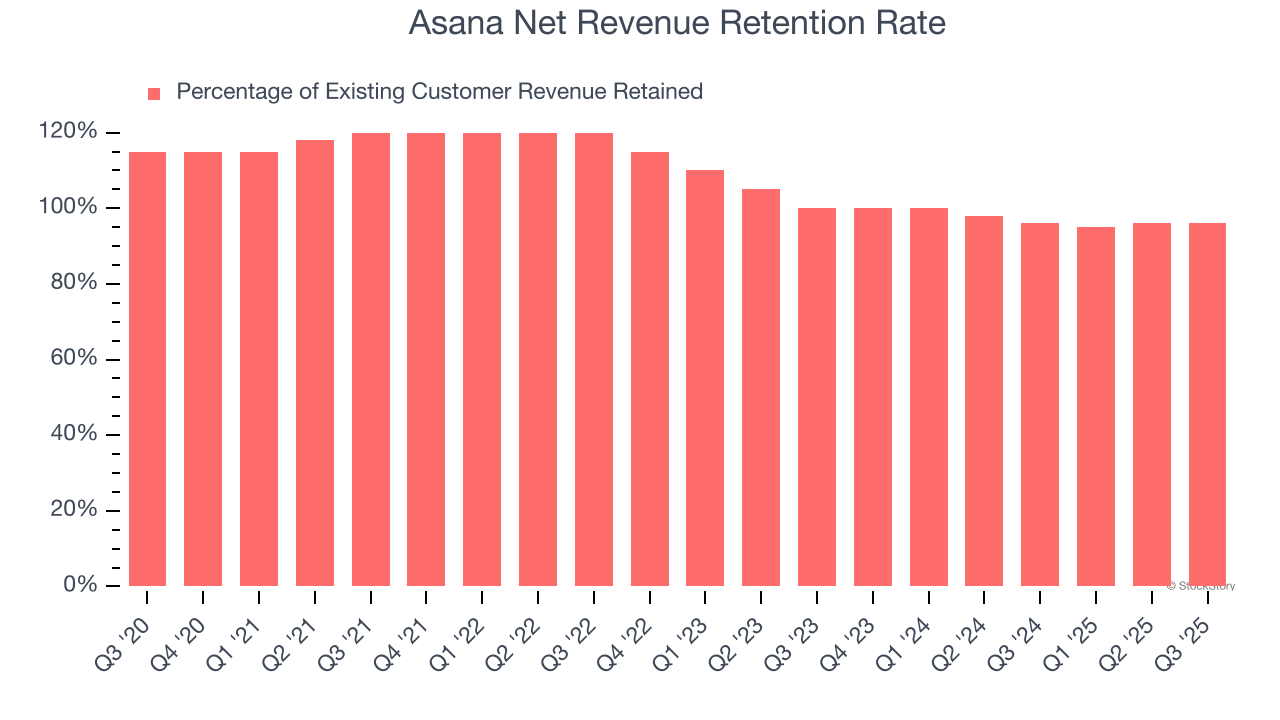
Asana has a weak net retention rate, signaling that some customers aren’t satisfied with its products, leading to lost contracts and revenue streams.
Key Takeaways from Asana’s Q3 Results
We were impressed by Asana’s optimistic EPS guidance for next quarter, which blew past analysts’ expectations. We were also glad its full-year EPS guidance trumped Wall Street’s estimates. Overall, we think this was a decent quarter with some key metrics above expectations. The stock traded up 4.1% to $13.98 immediately following the results.
Sure, Asana had a solid quarter, but if we look at the bigger picture, is this stock a buy? We think that the latest quarter is only one piece of the longer-term business quality puzzle. Quality, when combined with valuation, can help determine if the stock is a buy. We cover that in our actionable full research report which you can read here, it’s free for active Edge members.


