Beauty, cosmetics, and personal care retailer Ulta Beauty (NASDAQ: ULTA) reported Q3 CY2025 results beating Wall Street’s revenue expectations, with sales up 12.9% year on year to $2.86 billion. The company’s full-year revenue guidance of $12.3 billion at the midpoint came in 2% above analysts’ estimates. Its GAAP profit of $5.14 per share was 11.7% above analysts’ consensus estimates.
Is now the time to buy Ulta? Find out by accessing our full research report, it’s free for active Edge members.
Ulta (ULTA) Q3 CY2025 Highlights:
- Revenue: $2.86 billion vs analyst estimates of $2.72 billion (12.9% year-on-year growth, 5.2% beat)
- EPS (GAAP): $5.14 vs analyst estimates of $4.60 (11.7% beat)
- Adjusted EBITDA: $364.9 million vs analyst estimates of $349.4 million (12.8% margin, 4.4% beat)
- The company lifted its revenue guidance for the full year to $12.3 billion at the midpoint from $12.05 billion, a 2.1% increase
- EPS (GAAP) guidance for the full year is $25.35 at the midpoint, beating analyst estimates by 3.3%
- Operating Margin: 10.8%, down from 12.6% in the same quarter last year
- Free Cash Flow was -$81.63 million compared to -$171.1 million in the same quarter last year
- Locations: 1,500 at quarter end, up from 1,437 in the same quarter last year
- Same-Store Sales rose 6.3% year on year (0.6% in the same quarter last year)
- Market Capitalization: $24.42 billion
Company Overview
Offering high-end prestige brands as well as lower-priced, mass-market ones, Ulta Beauty (NASDAQ: ULTA) is an American retailer that sells makeup, skincare, haircare, and fragrance products.
Revenue Growth
Examining a company’s long-term performance can provide clues about its quality. Even a bad business can shine for one or two quarters, but a top-tier one grows for years.
With $11.98 billion in revenue over the past 12 months, Ulta is a mid-sized retailer, which sometimes brings disadvantages compared to larger competitors benefiting from better economies of scale.
As you can see below, Ulta grew its sales at a tepid 7.3% compounded annual growth rate over the last three years (we compare to 2019 to normalize for COVID-19 impacts), but to its credit, it opened new stores and increased sales at existing, established locations.
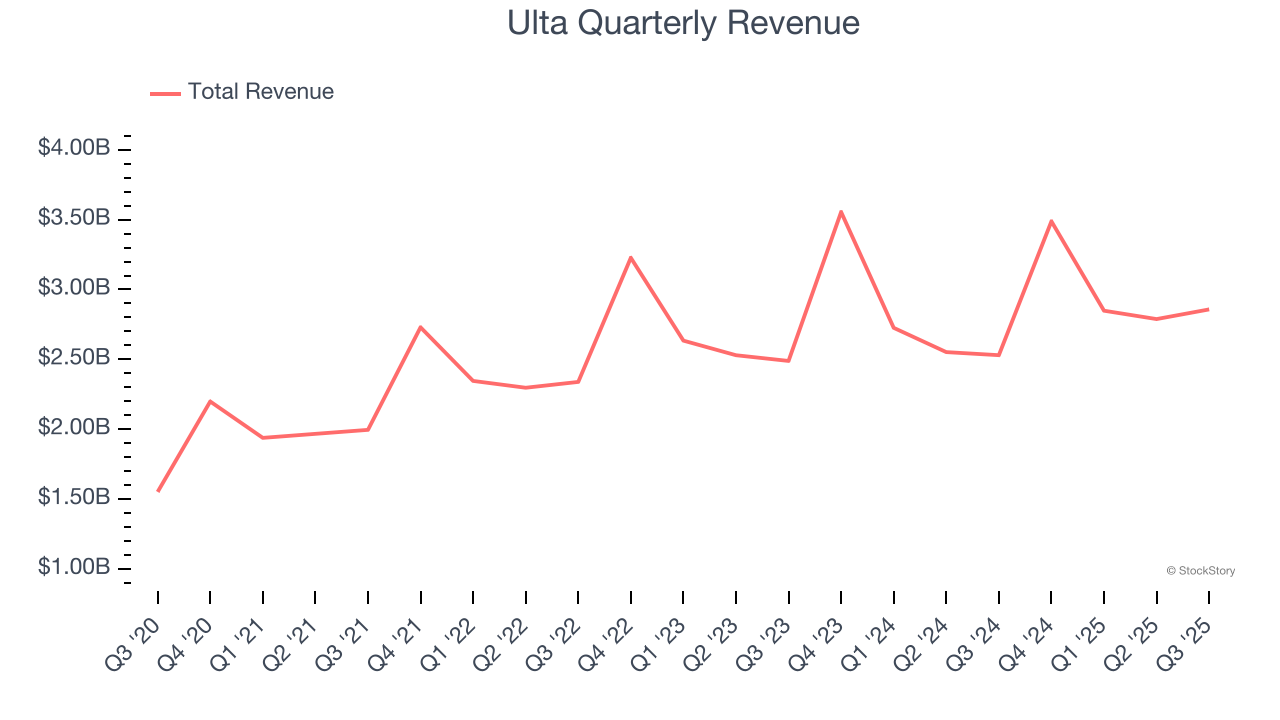
This quarter, Ulta reported year-on-year revenue growth of 12.9%, and its $2.86 billion of revenue exceeded Wall Street’s estimates by 5.2%.
Looking ahead, sell-side analysts expect revenue to grow 4.7% over the next 12 months, a slight deceleration versus the last three years. We still think its growth trajectory is attractive given its scale and indicates the market is baking in success for its products.
Microsoft, Alphabet, Coca-Cola, Monster Beverage—all began as under-the-radar growth stories riding a massive trend. We’ve identified the next one: a profitable AI semiconductor play Wall Street is still overlooking. Go here for access to our full report.
Store Performance
Number of Stores
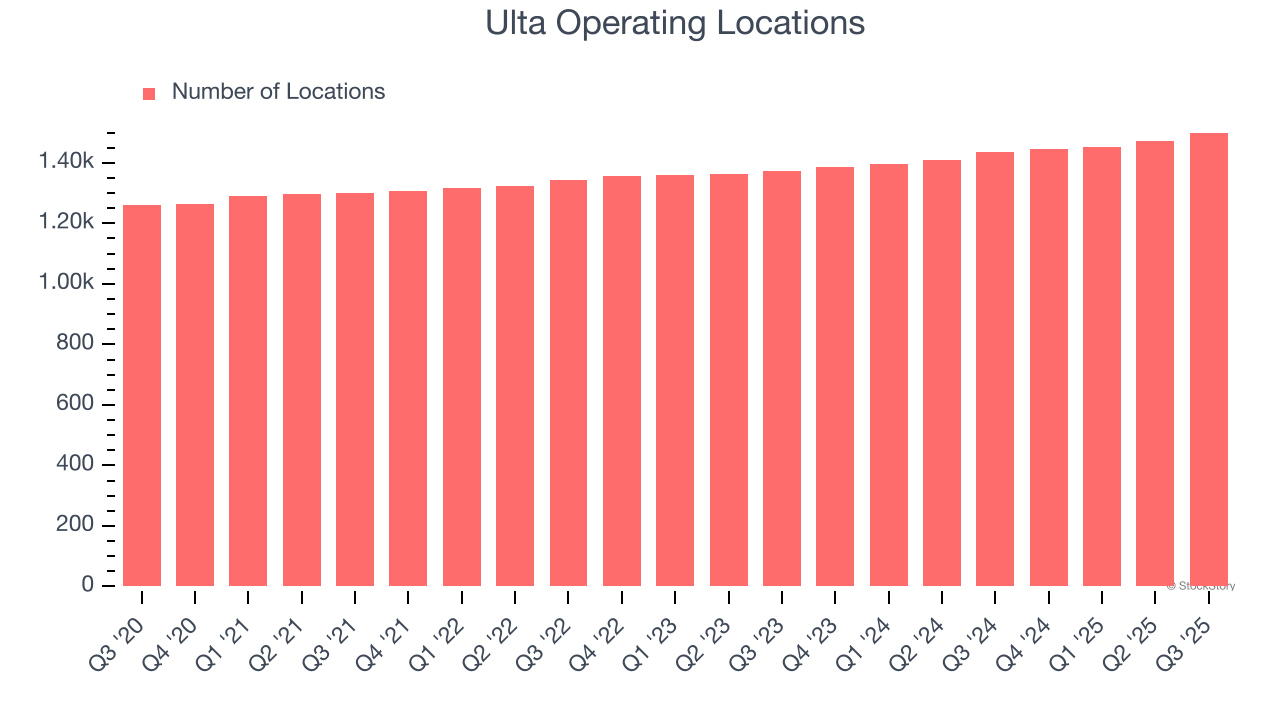
The number of stores a retailer operates is a critical driver of how quickly company-level sales can grow.
Ulta operated 1,500 locations in the latest quarter. It has opened new stores quickly over the last two years, averaging 3.8% annual growth, faster than the broader consumer retail sector.
When a retailer opens new stores, it usually means it’s investing for growth because demand is greater than supply, especially in areas where consumers may not have a store within reasonable driving distance.
Same-Store Sales
The change in a company's store base only tells one side of the story. The other is the performance of its existing locations and e-commerce sales, which informs management teams whether they should expand or downsize their physical footprints. Same-store sales provides a deeper understanding of this issue because it measures organic growth at brick-and-mortar shops for at least a year.
Ulta’s demand has been healthy for a retailer over the last two years. On average, the company has grown its same-store sales by a robust 2.6% per year. This performance suggests its rollout of new stores could be beneficial for shareholders. When a retailer has demand, more locations should help it reach more customers and boost revenue growth.
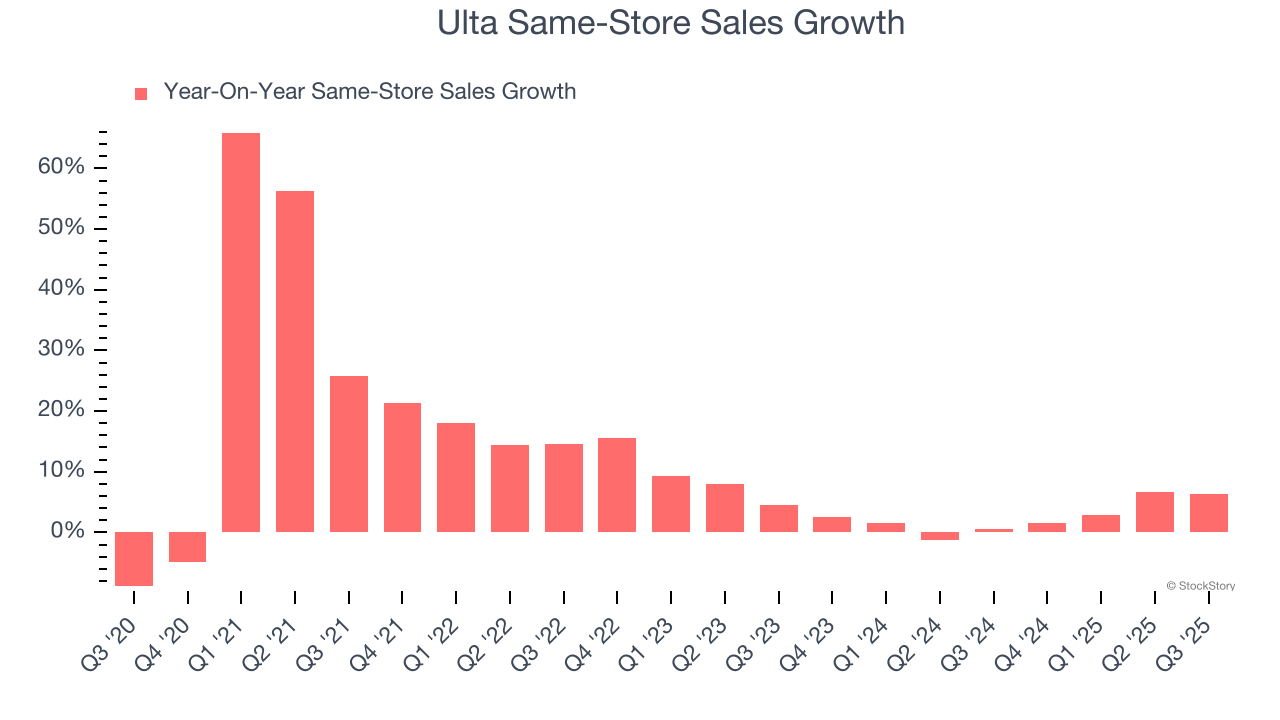
In the latest quarter, Ulta’s same-store sales rose 6.3% year on year. This growth was an acceleration from its historical levels, which is always an encouraging sign.
Key Takeaways from Ulta’s Q3 Results
We were impressed by how significantly Ulta blew past analysts’ revenue expectations this quarter. We were also glad its full-year EPS guidance exceeded Wall Street’s estimates. Zooming out, we think this was a good print with some key areas of upside. The stock traded up 2.9% to $549.51 immediately following the results.
Ulta may have had a good quarter, but does that mean you should invest right now? We think that the latest quarter is only one piece of the longer-term business quality puzzle. Quality, when combined with valuation, can help determine if the stock is a buy. We cover that in our actionable full research report which you can read here, it’s free for active Edge members.