
Ride sharing service Lyft (NASDAQ: LYFT) fell short of the market’s revenue expectations in Q4 CY2024, but sales rose 26.6% year on year to $1.55 billion. Its GAAP profit of $0.15 per share was significantly above analysts’ consensus estimates.
Is now the time to buy Lyft? Find out by accessing our full research report, it’s free.
Lyft (LYFT) Q4 CY2024 Highlights:
- Revenue: $1.55 billion vs analyst estimates of $1.56 billion (26.6% year-on-year growth, 0.9% miss)
- EPS (GAAP): $0.15 vs analyst estimates of -$0.01 (significant beat)
- Adjusted EBITDA: $112.8 million vs analyst estimates of $103.9 million (7.3% margin, 8.6% beat)
- EBITDA guidance for Q1 CY2025 is $92.5 million at the midpoint, below analyst estimates of $94.16 million
- Operating Margin: 1.8%, up from -4.9% in the same quarter last year
- Free Cash Flow Margin: 9%, down from 15.9% in the previous quarter
- Active Riders: 24.7 million, up 2.3 million year on year
- Market Capitalization: $6.27 billion
Company Overview
Founded by Logan Green and John Zimmer as a long-distance intercity carpooling company Zimride, Lyft (NASDAQ: LYFT) operates a ridesharing network in the US and Canada.
Gig Economy
The iPhone changed the world, ushering in the era of the “always-on” internet and “on-demand” services - anything someone could want is just a few taps away. Likewise, the gig economy sprang up in a similar fashion, with a proliferation of tech-enabled freelance labor marketplaces, which work hand and hand with many on demand services. Individuals can now work on demand too. What began with tech-enabled platforms that aggregated riders and drivers has expanded over the past decade to include food delivery, groceries, and now even a plumber or graphic designer are all just a few taps away.
Sales Growth
Reviewing a company’s long-term sales performance reveals insights into its quality. Any business can have short-term success, but a top-tier one grows for years. Thankfully, Lyft’s 21.7% annualized revenue growth over the last three years was impressive. Its growth beat the average consumer internet company and shows its offerings resonate with customers, a helpful starting point for our analysis.
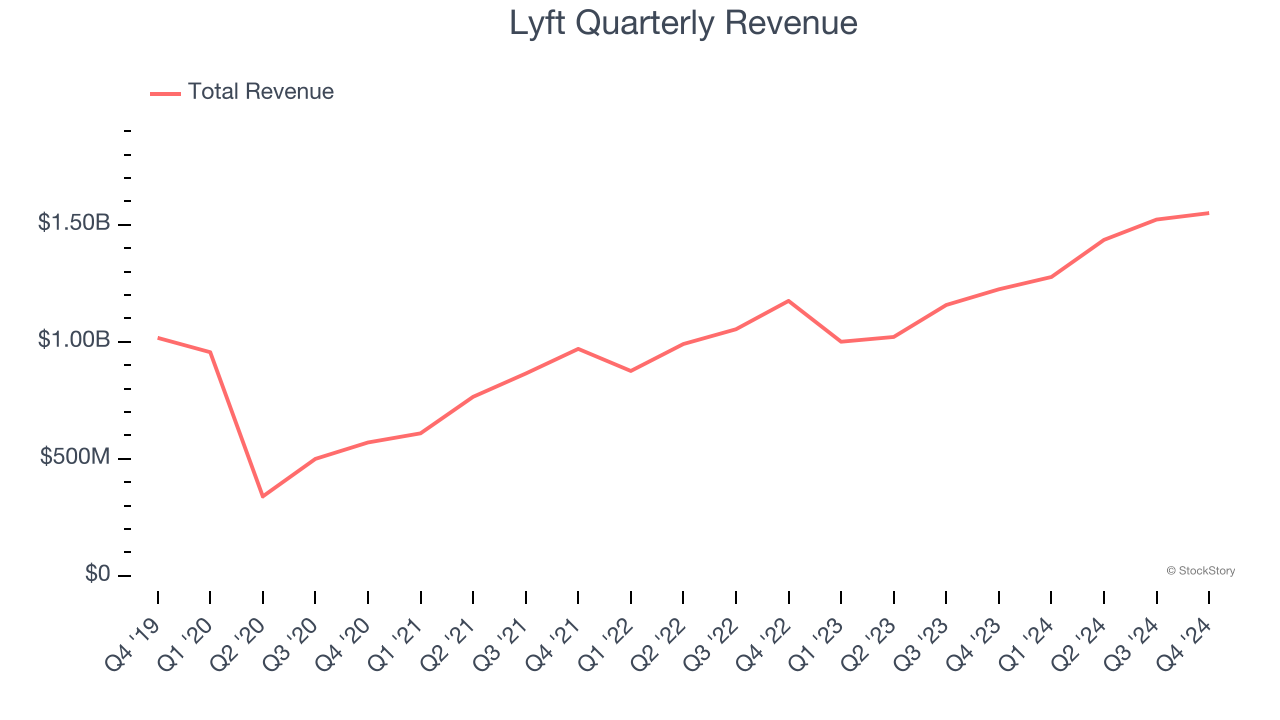
This quarter, Lyft generated an excellent 26.6% year-on-year revenue growth rate, but its $1.55 billion of revenue fell short of Wall Street’s high expectations.
Looking ahead, sell-side analysts expect revenue to grow 15.9% over the next 12 months, a deceleration versus the last three years. Despite the slowdown, this projection is commendable and suggests the market sees success for its products and services.
Here at StockStory, we certainly understand the potential of thematic investing. Diverse winners from Microsoft (MSFT) to Alphabet (GOOG), Coca-Cola (KO) to Monster Beverage (MNST) could all have been identified as promising growth stories with a megatrend driving the growth. So, in that spirit, we’ve identified a relatively under-the-radar profitable growth stock benefiting from the rise of AI, available to you FREE via this link.
Active Riders
User Growth
As a gig economy marketplace, Lyft generates revenue growth by expanding the number of services on its platform (e.g. rides, deliveries, freelance jobs) and raising the commission fee from each service provided.
Over the last two years, Lyft’s active riders, a key performance metric for the company, increased by 10% annually to 24.7 million in the latest quarter. This growth rate is solid for a consumer internet business and indicates people are excited about its offerings. 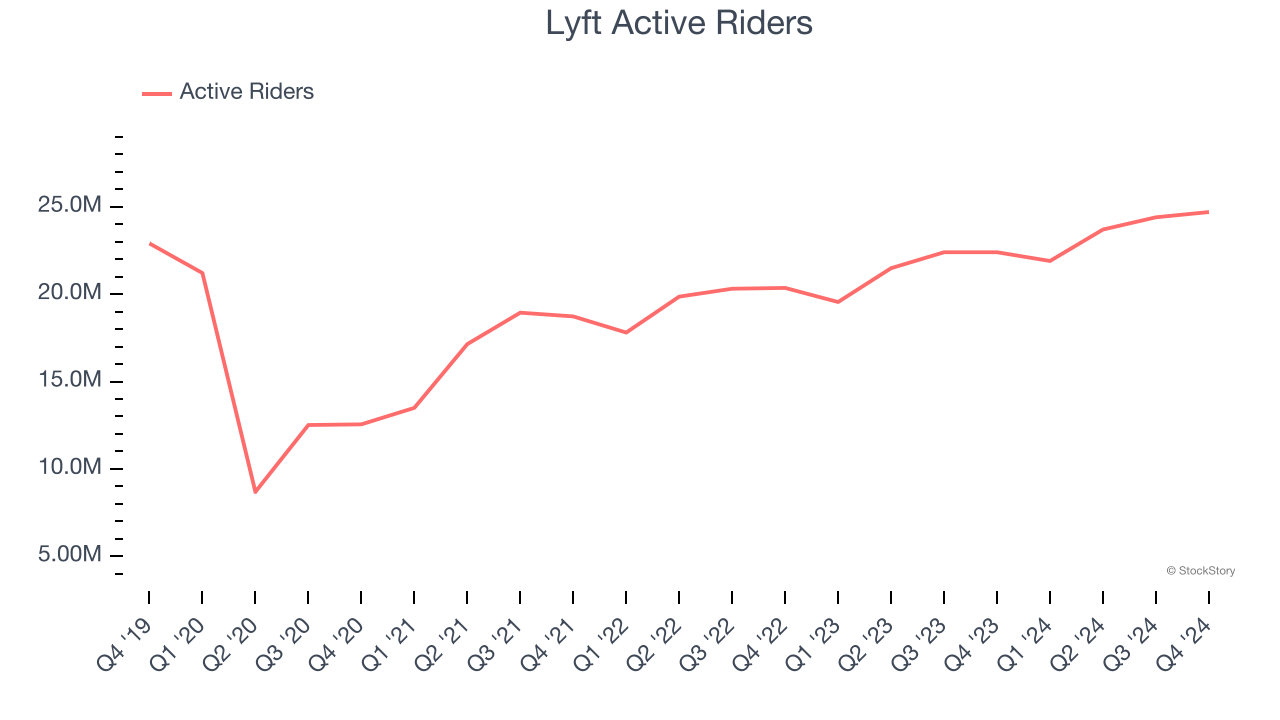
In Q4, Lyft added 2.3 million active riders, leading to 10.3% year-on-year growth. The quarterly print isn’t too different from its two-year result, suggesting its new initiatives aren’t accelerating user growth just yet.
Revenue Per User
Average revenue per user (ARPU) is a critical metric to track for gig economy businesses like Lyft because it measures how much the company earns in transaction fees from each user. This number also informs us about Lyft’s take rate, which represents its pricing leverage over the ecosystem, or "cut" from each transaction.
Lyft’s ARPU growth has been impressive over the last two years, averaging 8.8%. Its ability to increase monetization while quickly growing its active riders reflects the strength of its platform, as its users continue to spend more each year. 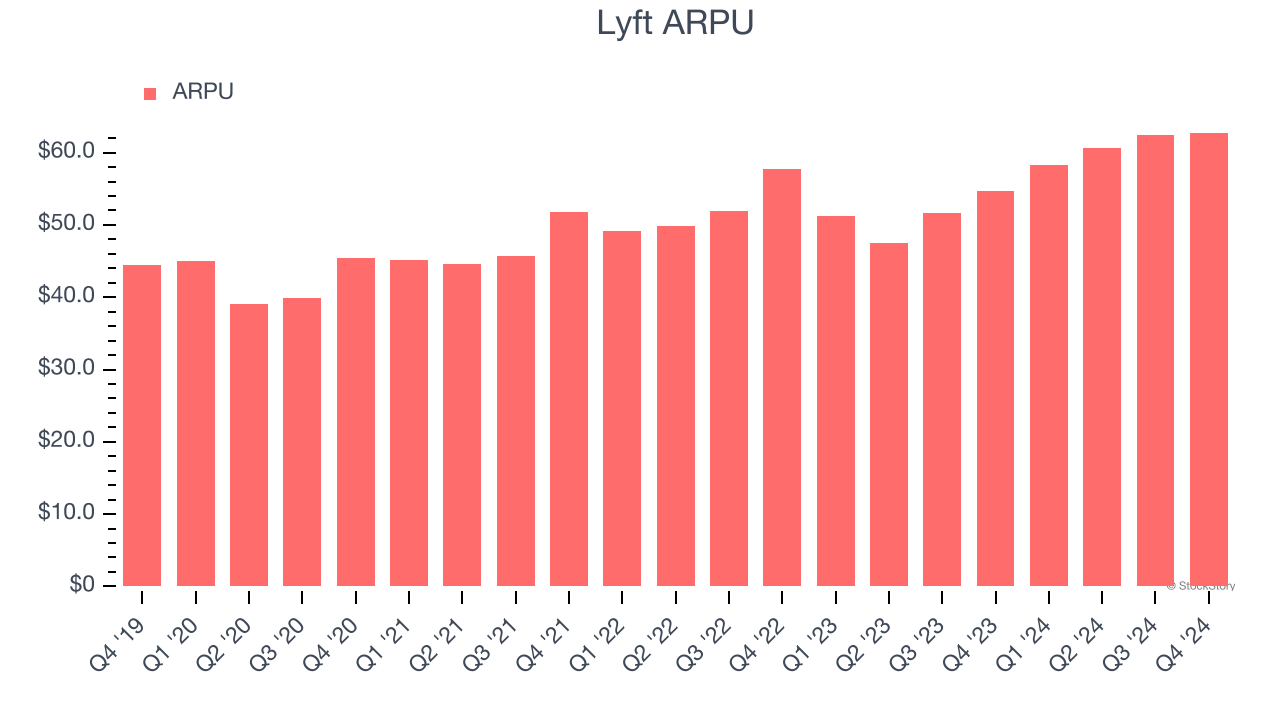
This quarter, Lyft’s ARPU clocked in at $62.77. It grew by 14.8% year on year, faster than its active riders.
Key Takeaways from Lyft’s Q4 Results
We were impressed by how significantly Lyft blew past analysts’ EBITDA and EPS expectations this quarter. We were also glad it expanded its number of users. On the other hand, its revenue slightly missed and its EBITDA guidance for next quarter fell short of Wall Street’s estimates. Overall, this was a weaker quarter. The stock traded down 9.8% to $13 immediately following the results.
Is Lyft an attractive investment opportunity at the current price? When making that decision, it’s important to consider its valuation, business qualities, as well as what has happened in the latest quarter. We cover that in our actionable full research report which you can read here, it’s free.