
Over the past six months, Patterson Companies has been a great trade, beating the S&P 500 by 15.5%. Its stock price has climbed to $31.03, representing a healthy 27.7% increase. This performance may have investors wondering how to approach the situation.
Is there a buying opportunity in Patterson Companies, or does it present a risk to your portfolio? Check out our in-depth research report to see what our analysts have to say, it’s free.
Despite the momentum, we're sitting this one out for now. Here are three reasons why there are better opportunities than PDCO and a stock we'd rather own.
Why Is Patterson Companies Not Exciting?
Founded in 1877, Patterson Companies (NASDAQ: PDCO) offers a wide range of equipment, consumables, software, and services to professionals in the dental and animal health markets.
1. Slow Organic Growth Suggests Waning Demand In Core Business
We can better understand Healthcare Distribution & Related Services companies by analyzing their organic revenue. This metric gives visibility into Patterson Companies’s core business because it excludes one-time events such as mergers, acquisitions, and divestitures along with foreign currency fluctuations - non-fundamental factors that can manipulate the income statement.
Over the last two years, Patterson Companies’s organic revenue averaged 1.1% year-on-year growth. This performance was underwhelming and suggests it may need to improve its products, pricing, or go-to-market strategy, which can add an extra layer of complexity to its operations. 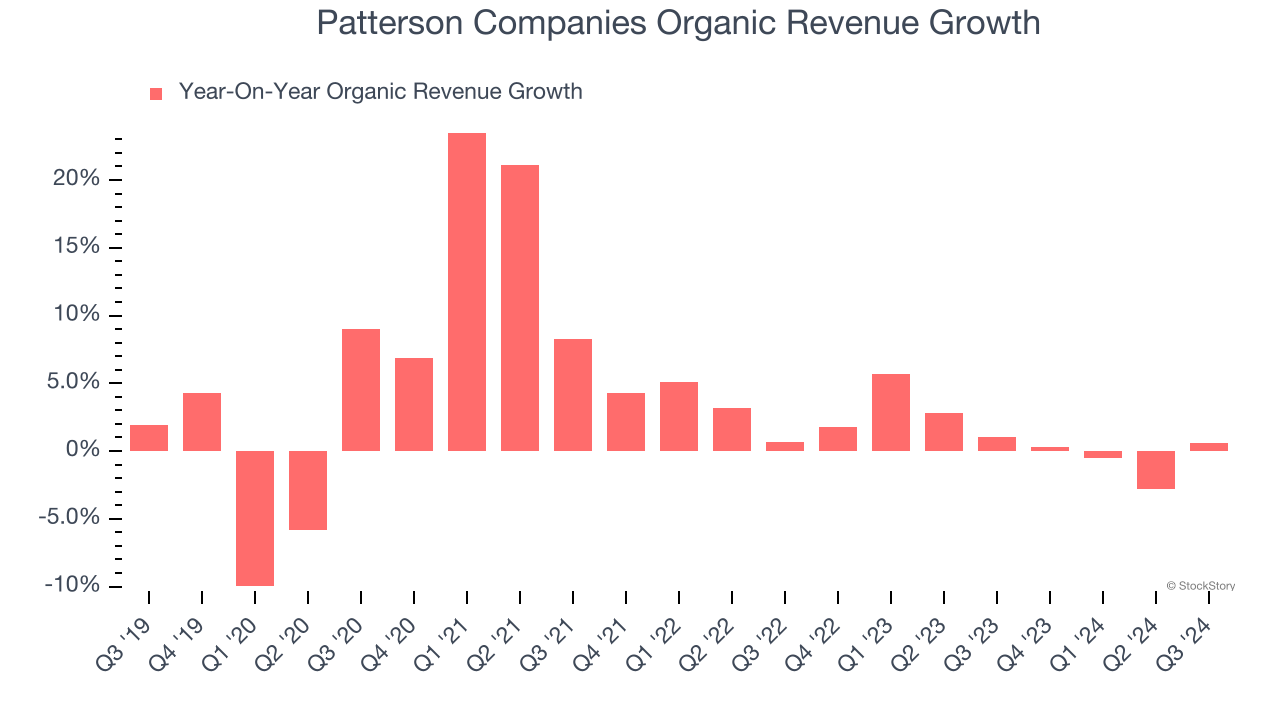
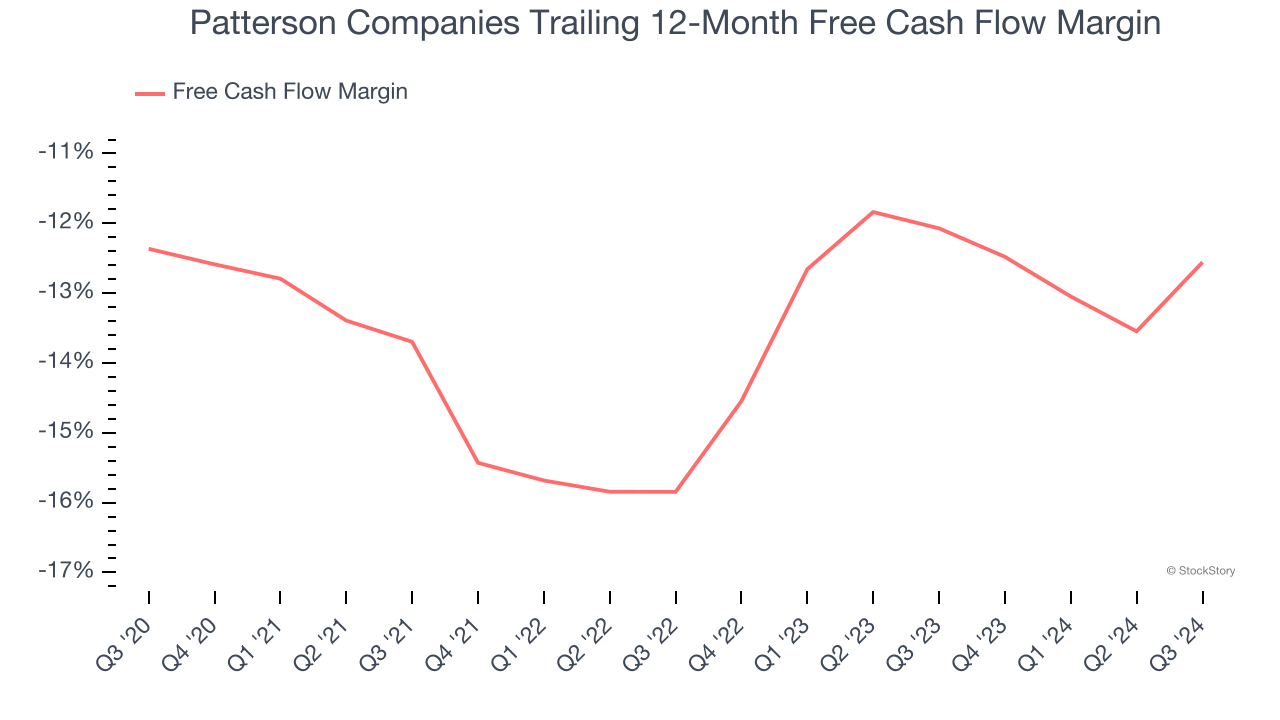
2. Cash Burn Ignites Concerns
Free cash flow isn't a prominently featured metric in company financials and earnings releases, but we think it's telling because it accounts for all operating and capital expenses, making it tough to manipulate. Cash is king.
Patterson Companies’s demanding reinvestments have consumed many resources over the last five years, contributing to an average free cash flow margin of negative 13.3%. This means it lit $13.32 of cash on fire for every $100 in revenue.
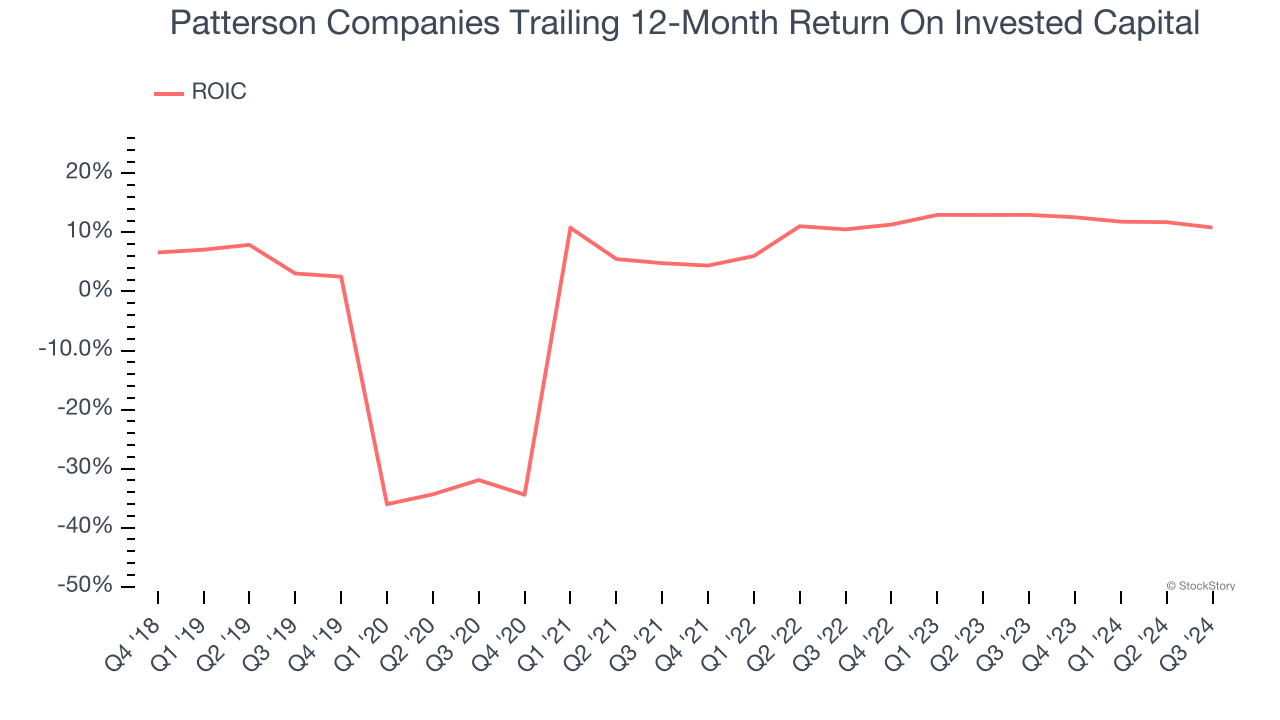
3. Previous Growth Initiatives Haven’t Paid Off Yet
Growth gives us insight into a company’s long-term potential, but how capital-efficient was that growth? A company’s ROIC explains this by showing how much operating profit it makes compared to the money it has raised (debt and equity).
Patterson Companies historically did a mediocre job investing in profitable growth initiatives. Its five-year average ROIC was 1.4%, lower than the typical cost of capital (how much it costs to raise money) for healthcare companies.
Final Judgment
Patterson Companies isn’t a terrible business, but it doesn’t pass our quality test. With its shares topping the market in recent months, the stock trades at 12.5× forward price-to-earnings (or $31.03 per share). Investors with a higher risk tolerance might like the company, but we think the potential downside is too great. We're pretty confident there are superior stocks to buy right now. We’d suggest looking at the Amazon and PayPal of Latin America.
Stocks We Would Buy Instead of Patterson Companies
With rates dropping, inflation stabilizing, and the elections in the rearview mirror, all signs point to the start of a new bull run - and we’re laser-focused on finding the best stocks for this upcoming cycle.
Put yourself in the driver’s seat by checking out our Top 5 Growth Stocks for this month. This is a curated list of our High Quality stocks that have generated a market-beating return of 175% over the last five years.
Stocks that made our list in 2019 include now familiar names such as Nvidia (+2,183% between December 2019 and December 2024) as well as under-the-radar businesses like Sterling Infrastructure (+1,096% five-year return). Find your next big winner with StockStory today for free.


