
Let’s dig into the relative performance of Amphastar Pharmaceuticals (NASDAQ: AMPH) and its peers as we unravel the now-completed Q3 generic pharmaceuticals earnings season.
The generic pharmaceutical industry operates on a volume-driven, low-cost business model, producing bioequivalent versions of branded drugs once their patents expire. These companies benefit from consistent demand for affordable medications, as they are critical to reducing healthcare costs. Generics typically face lower R&D expenses and shorter regulatory approval timelines compared to branded drug makers, enabling cost efficiencies. However, the industry is highly competitive, with intense pricing pressures, thin margins, and frequent legal challenges from branded pharmaceutical companies over patent disputes.
Looking ahead, the industry is supported by tailwinds such as the role of AI in streamlining drug development (reverse engineering complex formulations) and manufacturing efficiency (optimize processes and remove inefficiencies). Governments and insurers' focus on reducing drug costs can also boost generics' adoption. However, headwinds include escalating pricing pressure from large buyers like pharmacy chains and healthcare distributors as well as evolving regulatory hurdles.
The 4 generic pharmaceuticals stocks we track reported a mixed Q3. As a group, revenues beat analysts’ consensus estimates by 1%.
Amidst this news, share prices of the companies have had a rough stretch. On average, they are down 13.8% since the latest earnings results.
Weakest Q3: Amphastar Pharmaceuticals (NASDAQ: AMPH)
Founded in 1996, Amphastar Pharmaceuticals (NASDAQ: AMPH) develops, manufactures, and markets injectable and inhalation products, focusing on critical care, emergency, and chronic conditions.
Amphastar Pharmaceuticals reported revenues of $191.2 million, up 5.9% year on year. This print fell short of analysts’ expectations by 1%. Overall, it was a softer quarter for the company with a miss of analysts’ EPS estimates.
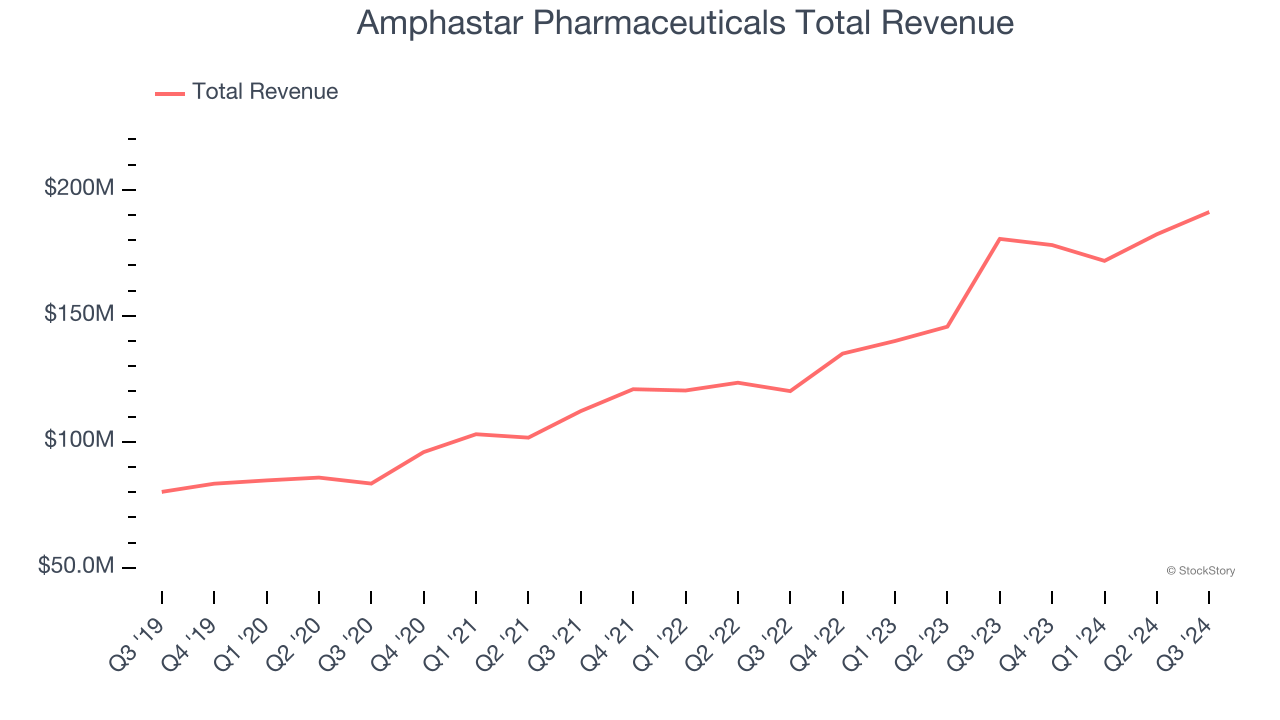
Amphastar Pharmaceuticals delivered the weakest performance against analyst estimates of the whole group. The stock is down 42% since reporting and currently trades at $31.
Is now the time to buy Amphastar Pharmaceuticals? Access our full analysis of the earnings results here, it’s free.
Best Q3: ANI Pharmaceuticals (NASDAQ: ANIP)
Founded in 2001, ANI Pharmaceuticals (NASDAQ: ANIP) develops, manufactures, and markets branded and generic pharmaceutical products, with a focus on complex formulations and niche markets.
ANI Pharmaceuticals reported revenues of $148.3 million, up 12.5% year on year, outperforming analysts’ expectations by 1.5%. The business had a very strong quarter with a solid beat of analysts’ full-year EPS guidance estimates.
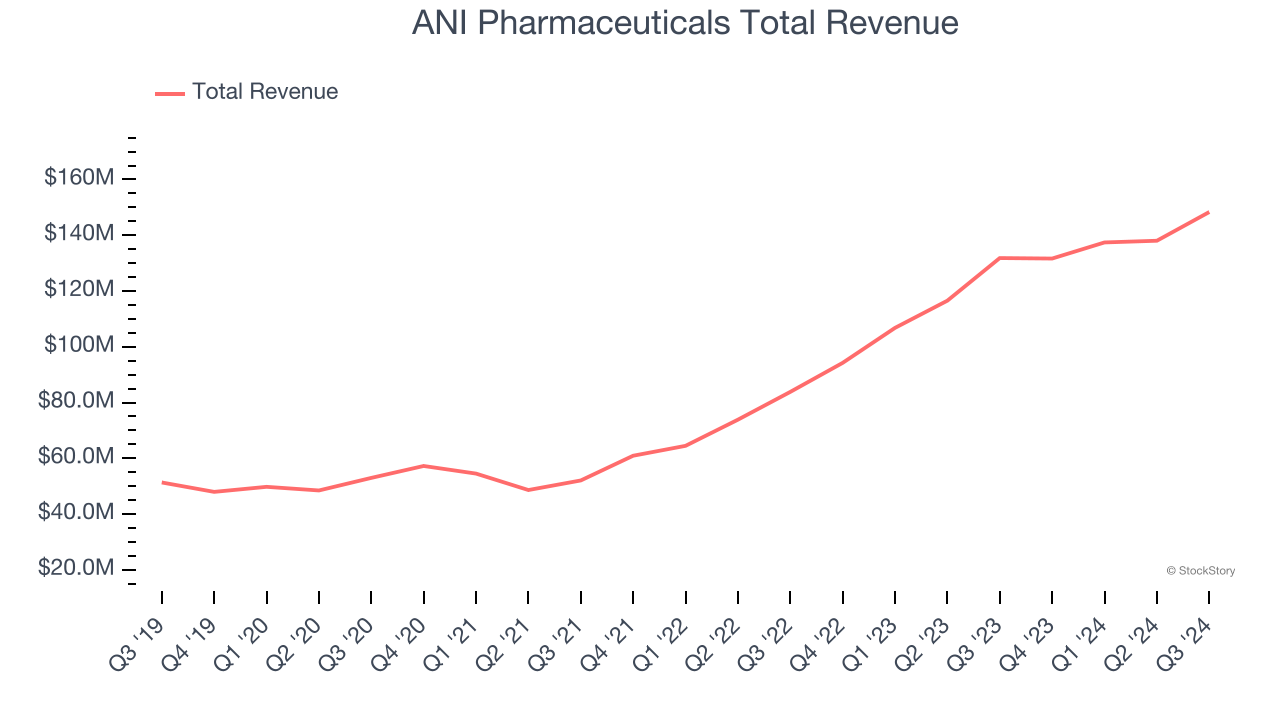
ANI Pharmaceuticals pulled off the highest full-year guidance raise among its peers. The market seems content with the results as the stock is up 1.7% since reporting. It currently trades at $59.19.
Is now the time to buy ANI Pharmaceuticals? Access our full analysis of the earnings results here, it’s free.
Viatris (NASDAQ: VTRS)
Formed in 2020 through the merger of Mylan and Upjohn, Viatris (NASDAQ: VTRS) provides a portfolio of branded, generic, and over-the-counter medications as well as biosimilars aimed at addressing a wide range of therapeutic areas.
Viatris reported revenues of $3.75 billion, down 4.8% year on year, exceeding analysts’ expectations by 1%. Still, it was a mixed quarter as it posted a slight miss of analysts’ full-year EPS guidance estimates.
Viatris delivered the slowest revenue growth in the group. As expected, the stock is down 7.1% since the results and currently trades at $10.79.
Read our full analysis of Viatris’s results here.
Amneal (NASDAQ: AMRX)
Founded in 2002, Amneal Pharmaceuticals (NASDAQ: AMRX) develops, manufactures, and distributes a diverse portfolio of pharmaceuticals.
Amneal reported revenues of $702.5 million, up 13.3% year on year. This number beat analysts’ expectations by 2.4%. Taking a step back, it was a satisfactory quarter as it also recorded a solid beat of analysts’ EPS estimates but full-year revenue guidance meeting analysts’ expectations.
Amneal pulled off the biggest analyst estimates beat and fastest revenue growth, but had the weakest full-year guidance update among its peers. The stock is down 7.9% since reporting and currently trades at $7.92.
Read our full, actionable report on Amneal here, it’s free.
Want to invest in winners with rock-solid fundamentals? Check out our Hidden Gem Stocks and add them to your watchlist. These companies are poised for growth regardless of the political or macroeconomic climate.
Join Paid Stock Investor Research
Help us make StockStory more helpful to investors like yourself. Join our paid user research session and receive a $50 Amazon gift card for your opinions. Sign up here.