
Restaurant company Cheesecake Factory (NASDAQ: CAKE) beat Wall Street’s revenue expectations in Q4 CY2024, with sales up 5% year on year to $921 million. Its non-GAAP profit of $1.04 per share was 13.7% above analysts’ consensus estimates.
Is now the time to buy The Cheesecake Factory? Find out by accessing our full research report, it’s free.
The Cheesecake Factory (CAKE) Q4 CY2024 Highlights:
- Revenue: $921 million vs analyst estimates of $913.2 million (5% year-on-year growth, 0.9% beat)
- Adjusted EPS: $1.04 vs analyst estimates of $0.91 (13.7% beat)
- Adjusted EBITDA: $73.07 million vs analyst estimates of $76.31 million (7.9% margin, 4.3% miss)
- Operating Margin: 5.1%, up from 0.9% in the same quarter last year
- Locations: 348 at quarter end, down from 363 in the same quarter last year
- Market Capitalization: $2.63 billion
“Our fourth quarter performance capped off an excellent year, with solid revenue and earnings contributing to record annual revenue and substantially improved profitability for 2024,” said David Overton, Chairman and Chief Executive Officer.
Company Overview
Celebrated for its delicious (and free) brown bread, gigantic portions, and delectable desserts, Cheesecake Factory (NASDAQ: CAKE) is an iconic American restaurant chain that also owns and operates a portfolio of separate restaurant brands.
Sit-Down Dining
Sit-down restaurants offer a complete dining experience with table service. These establishments span various cuisines and are renowned for their warm hospitality and welcoming ambiance, making them perfect for family gatherings, special occasions, or simply unwinding. Their extensive menus range from appetizers to indulgent desserts and wines and cocktails. This space is extremely fragmented and competition includes everything from publicly-traded companies owning multiple chains to single-location mom-and-pop restaurants.
Sales Growth
A company’s long-term sales performance can indicate its overall quality. Any business can put up a good quarter or two, but many enduring ones grow for years.
With $3.58 billion in revenue over the past 12 months, The Cheesecake Factory is one of the larger restaurant chains in the industry and benefits from a well-known brand that influences consumer purchasing decisions.
As you can see below, The Cheesecake Factory grew its sales at a decent 7.6% compounded annual growth rate over the last five years (we compare to 2019 to normalize for COVID-19 impacts) as it opened new restaurants and increased sales at existing, established dining locations.
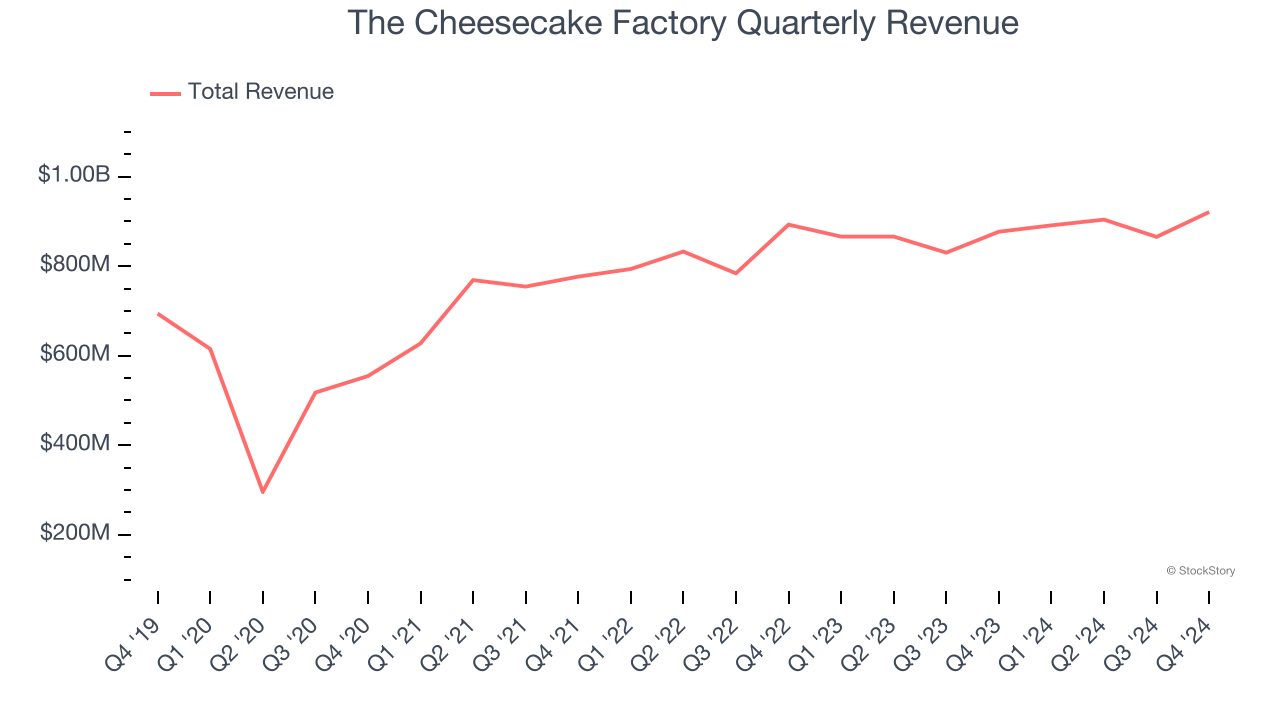
This quarter, The Cheesecake Factory reported year-on-year revenue growth of 5%, and its $921 million of revenue exceeded Wall Street’s estimates by 0.9%.
Looking ahead, sell-side analysts expect revenue to grow 5.1% over the next 12 months, a slight deceleration versus the last five years. This projection doesn't excite us and suggests its menu offerings will see some demand headwinds.
Today’s young investors won’t have read the timeless lessons in Gorilla Game: Picking Winners In High Technology because it was written more than 20 years ago when Microsoft and Apple were first establishing their supremacy. But if we apply the same principles, then enterprise software stocks leveraging their own generative AI capabilities may well be the Gorillas of the future. So, in that spirit, we are excited to present our Special Free Report on a profitable, fast-growing enterprise software stock that is already riding the automation wave and looking to catch the generative AI next.
Restaurant Performance
Number of Restaurants
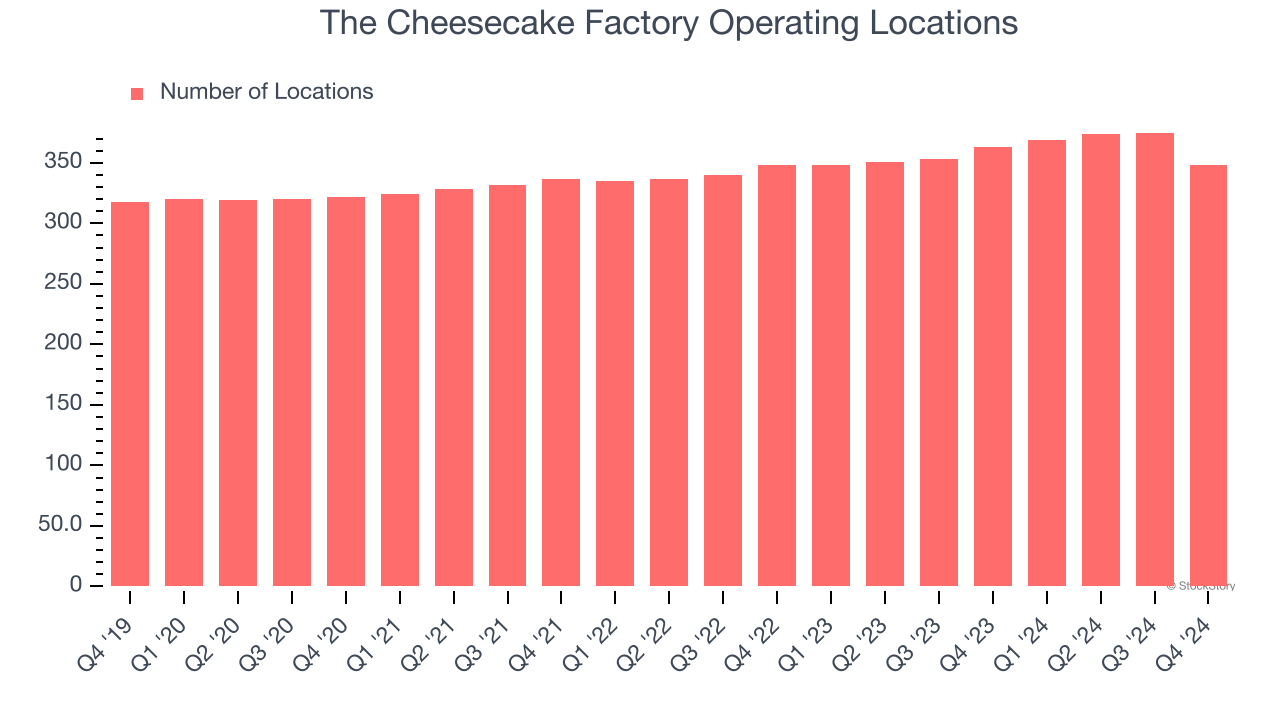
The number of dining locations a restaurant chain operates is a critical driver of how quickly company-level sales can grow.
The Cheesecake Factory operated 348 locations in the latest quarter. It has opened new restaurants at a rapid clip over the last two years, averaging 3.9% annual growth, much faster than the broader restaurant sector.
When a chain opens new restaurants, it usually means it’s investing for growth because there’s healthy demand for its meals and there are markets where its concepts have few or no locations.
Same-Store Sales
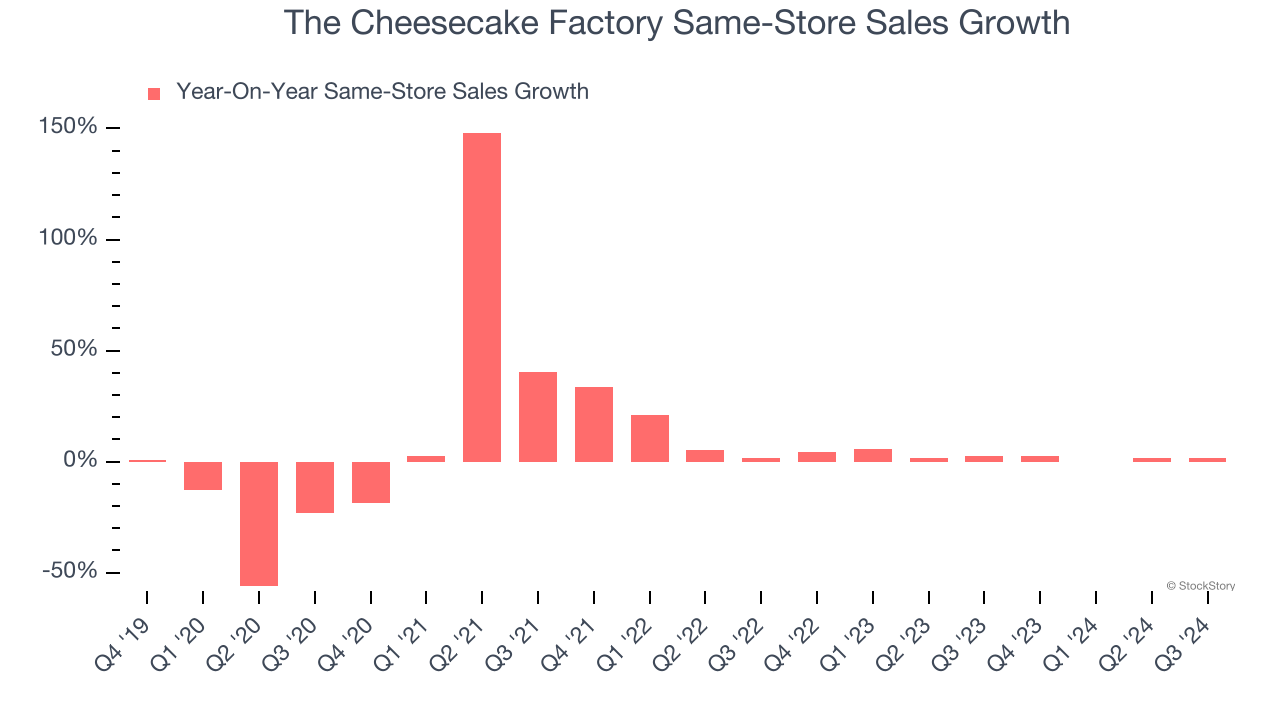
A company's restaurant base only paints one part of the picture. When demand is high, it makes sense to open more. But when demand is low, it’s prudent to close some locations and use the money in other ways. Same-store sales gives us insight into this topic because it measures organic growth at restaurants open for at least a year.
The Cheesecake Factory’s demand rose over the last two years and slightly outpaced the industry. On average, the company’s same-store sales have grown by 2.2% per year. This performance suggests its rollout of new restaurants could be beneficial for shareholders. When a chain has demand, more locations should help it reach more customers and boost revenue growth.
Note that The Cheesecake Factory reports its same-store sales intermittently, so some data points are missing in the chart below.
Key Takeaways from The Cheesecake Factory’s Q4 Results
We enjoyed seeing Mister Car Wash exceed analysts’ same-store sales expectations this quarter. We were also glad its EPS outperformed Wall Street’s estimates. On the other hand, its full-year revenue guidance missed and its full-year EBITDA guidance also fell slightly short of Wall Street’s estimates. It looks like the market is more focused on quarter than the guidance. The stock traded up 4.1% to $7.91 immediately after reporting.
Big picture, is The Cheesecake Factory a buy here and now? If you’re making that decision, you should consider the bigger picture of valuation, business qualities, as well as the latest earnings. We cover that in our actionable full research report which you can read here, it’s free.


