American restaurant chain BJ’s Restaurants (NASDAQ: BJRI) reported revenue ahead of Wall Street’s expectations in Q4 CY2024, with sales up 6.4% year on year to $344.3 million. Its GAAP loss of $0.23 per share was significantly below analysts’ consensus estimates.
Is now the time to buy BJ's? Find out by accessing our full research report, it’s free.
BJ's (BJRI) Q4 CY2024 Highlights:
- Revenue: $344.3 million vs analyst estimates of $336.5 million (6.4% year-on-year growth, 2.3% beat)
- EPS (GAAP): -$0.23 vs analyst estimates of $0.34 (significant miss)
- Adjusted EBITDA: $33.12 million vs analyst estimates of $30.69 million (9.6% margin, 7.9% beat)
- EBITDA guidance for the upcoming financial year 2025 is $132 million at the midpoint, above analyst estimates of $125.2 million
- Operating Margin: -1.4%, down from 1% in the same quarter last year
- Locations: 218 at quarter end, up from 216 in the same quarter last year
- Same-Store Sales rose 5.5% year on year (0.6% in the same quarter last year)
- Market Capitalization: $818.4 million
“Our fourth quarter results reflect significant progress in our efforts to drive sales and improve margins,” commented Brad Richmond, Interim Chief Executive Officer.
Company Overview
Founded in 1978 in California, BJ’s Restaurants (NASDAQ: BJRI) is a chain of restaurants whose menu features classic American dishes, often with a twist.
Sit-Down Dining
Sit-down restaurants offer a complete dining experience with table service. These establishments span various cuisines and are renowned for their warm hospitality and welcoming ambiance, making them perfect for family gatherings, special occasions, or simply unwinding. Their extensive menus range from appetizers to indulgent desserts and wines and cocktails. This space is extremely fragmented and competition includes everything from publicly-traded companies owning multiple chains to single-location mom-and-pop restaurants.
Sales Growth
A company’s long-term sales performance can indicate its overall quality. Any business can put up a good quarter or two, but many enduring ones grow for years.
With $1.36 billion in revenue over the past 12 months, BJ's is a mid-sized restaurant chain, which sometimes brings disadvantages compared to larger competitors benefiting from better brand awareness and economies of scale.
As you can see below, BJ’s sales grew at a sluggish 3.2% compounded annual growth rate over the last five years (we compare to 2019 to normalize for COVID-19 impacts) as its restaurant footprint remained unchanged.
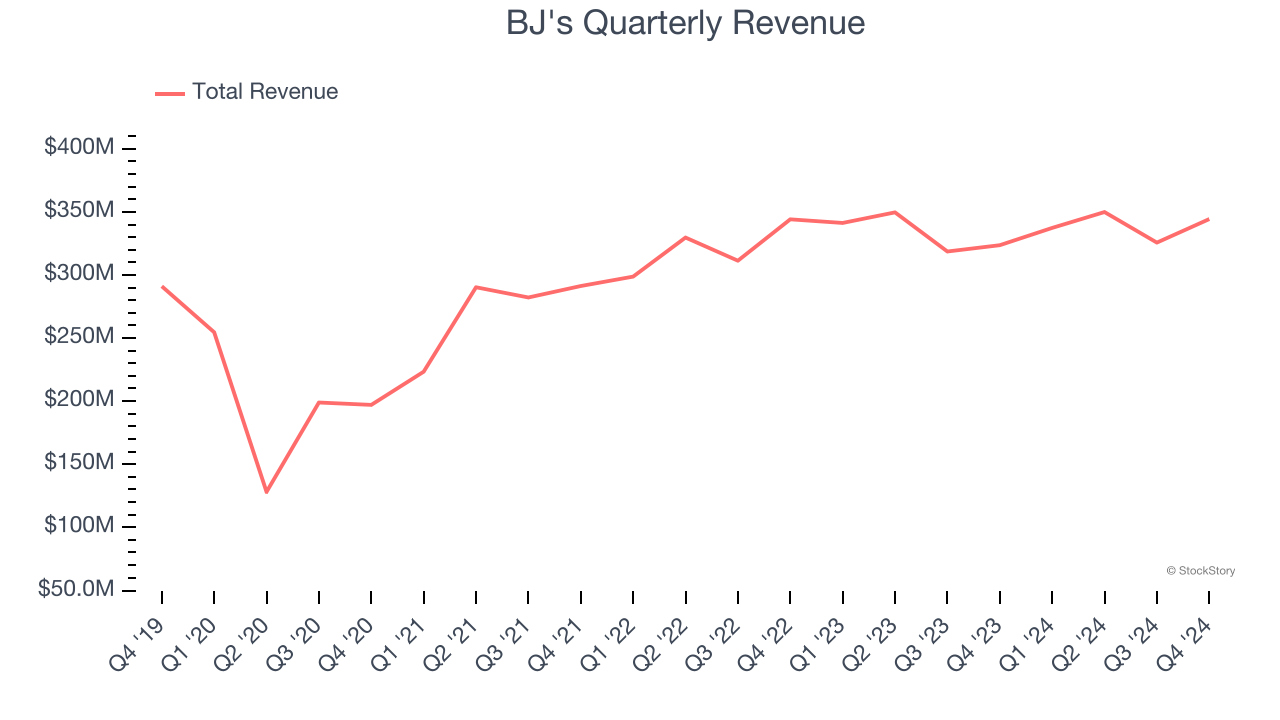
This quarter, BJ's reported year-on-year revenue growth of 6.4%, and its $344.3 million of revenue exceeded Wall Street’s estimates by 2.3%.
Looking ahead, sell-side analysts expect revenue to grow 2.6% over the next 12 months, similar to its five-year rate. This projection is underwhelming and suggests its newer menu offerings will not lead to better top-line performance yet.
Unless you’ve been living under a rock, it should be obvious by now that generative AI is going to have a huge impact on how large corporations do business. While Nvidia and AMD are trading close to all-time highs, we prefer a lesser-known (but still profitable) stock benefiting from the rise of AI. Click here to access our free report one of our favorites growth stories.
Restaurant Performance
Number of Restaurants
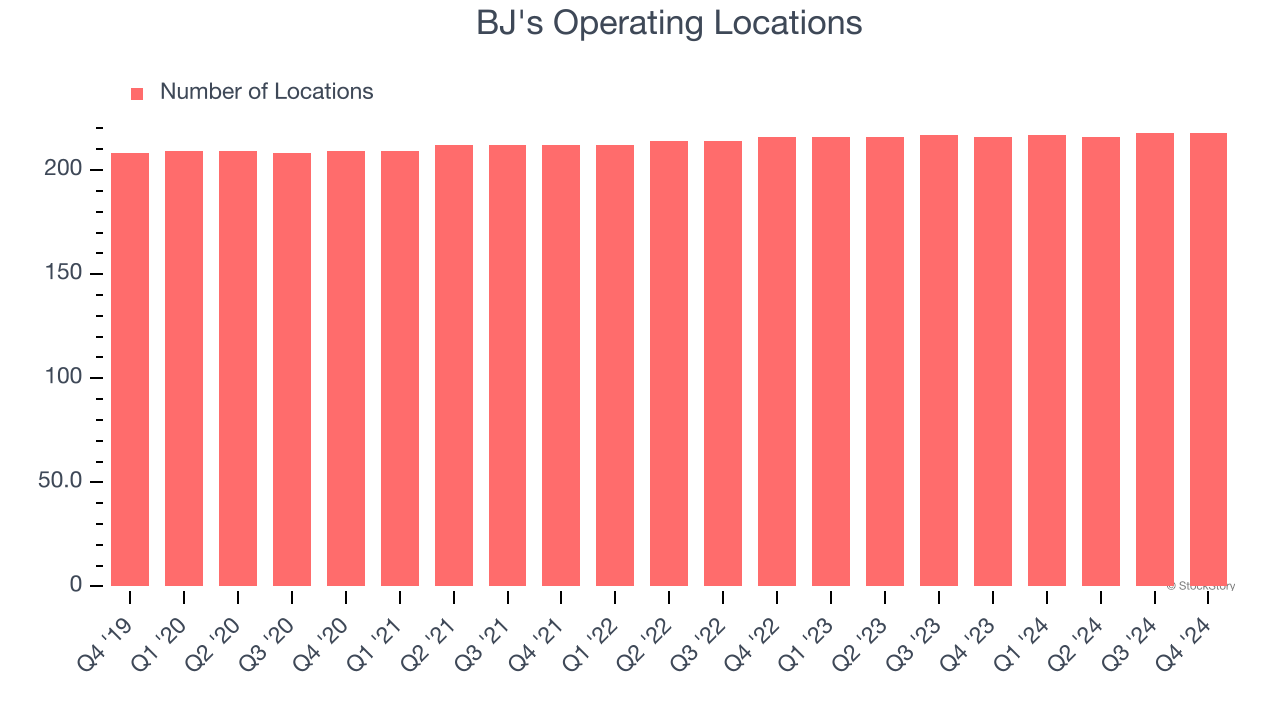
The number of dining locations a restaurant chain operates is a critical driver of how quickly company-level sales can grow.
BJ's listed 218 locations in the latest quarter and has kept its restaurant count flat over the last two years while other restaurant businesses have opted for growth.
When a chain doesn’t open many new restaurants, it usually means there’s stable demand for its meals and it’s focused on improving operational efficiency to increase profitability.
Same-Store Sales
A company's restaurant base only paints one part of the picture. When demand is high, it makes sense to open more. But when demand is low, it’s prudent to close some locations and use the money in other ways. Same-store sales provides a deeper understanding of this issue because it measures organic growth at restaurants open for at least a year.
BJ’s demand rose over the last two years and slightly outpaced the industry. On average, the company’s same-store sales have grown by 2.5% per year. Given its flat restaurant base over the same period, this performance stems from a mixture of higher prices and increased foot traffic at existing locations.
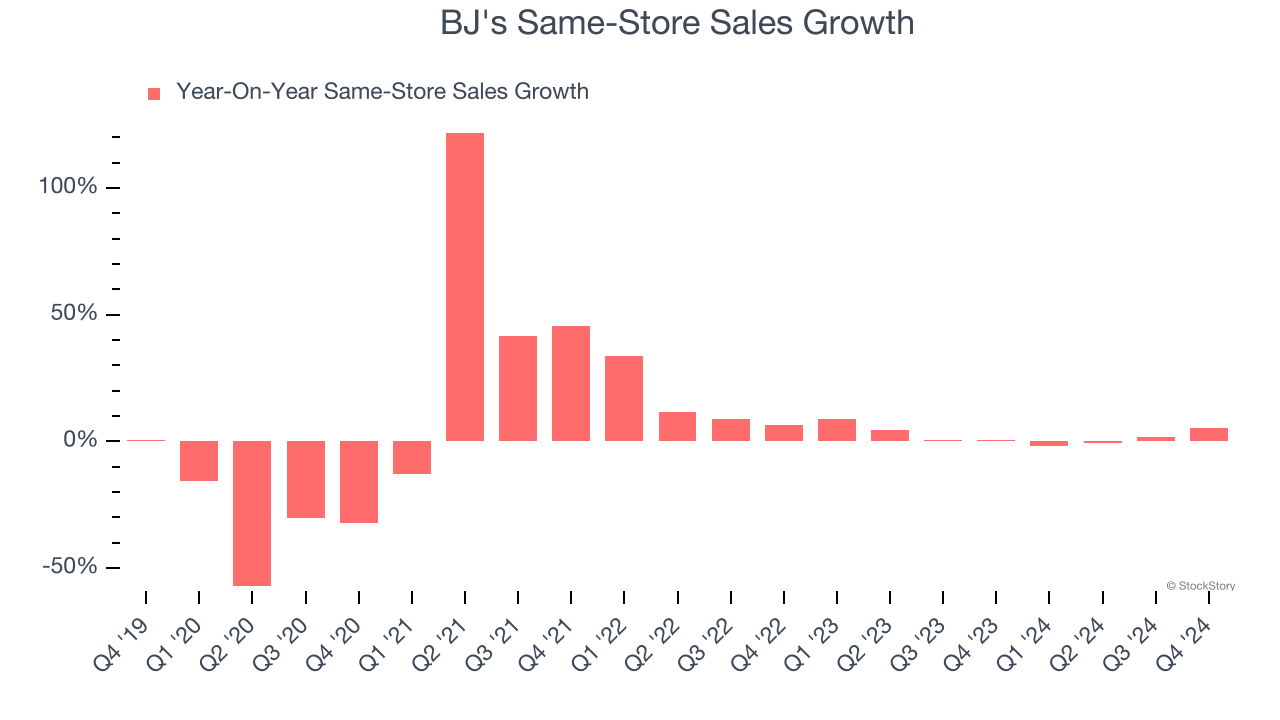
In the latest quarter, BJ’s same-store sales rose 5.5% year on year. This growth was an acceleration from its historical levels, which is always an encouraging sign.
Key Takeaways from BJ’s Q4 Results
We were impressed by how significantly BJ's blew past analysts’ same-store sales expectations this quarter, which enabled it to post revenue and EBITDA beats. We were also glad its full-year EBITDA guidance came in better than anticipated. Zooming out, we think this was a solid quarter. The stock traded up 11.3% to $39.75 immediately after reporting.
BJ's put up rock-solid earnings, but one quarter doesn’t necessarily make the stock a buy. Let’s see if this is a good investment. The latest quarter does matter, but not nearly as much as longer-term fundamentals and valuation, when deciding if the stock is a buy. We cover that in our actionable full research report which you can read here, it’s free.


