
Since August 2024, SMART has been in a holding pattern, posting a small return of 1.2% while floating around $21. The stock also fell short of the S&P 500’s 8.9% gain during that period.
Is there a buying opportunity in SMART, or does it present a risk to your portfolio? See what our analysts have to say in our full research report, it’s free.
We're swiping left on SMART for now. Here are three reasons why there are better opportunities than SGH and a stock we'd rather own.
Why Do We Think SMART Will Underperform?
Based in the US, SMART Global Holdings (NASDAQ: SGH) is a diversified semiconductor company offering memory, digital, and LED products.
1. Long-Term Revenue Growth Flatter Than a Pancake
A company’s long-term sales performance can indicate its overall quality. Any business can put up a good quarter or two, but many enduring ones grow for years. Unfortunately, SMART struggled to consistently increase demand as its $1.17 billion of sales for the trailing 12 months was close to its revenue five years ago. This fell short of our benchmarks and is a sign of poor business quality. Semiconductors are a cyclical industry, and long-term investors should be prepared for periods of high growth followed by periods of revenue contractions.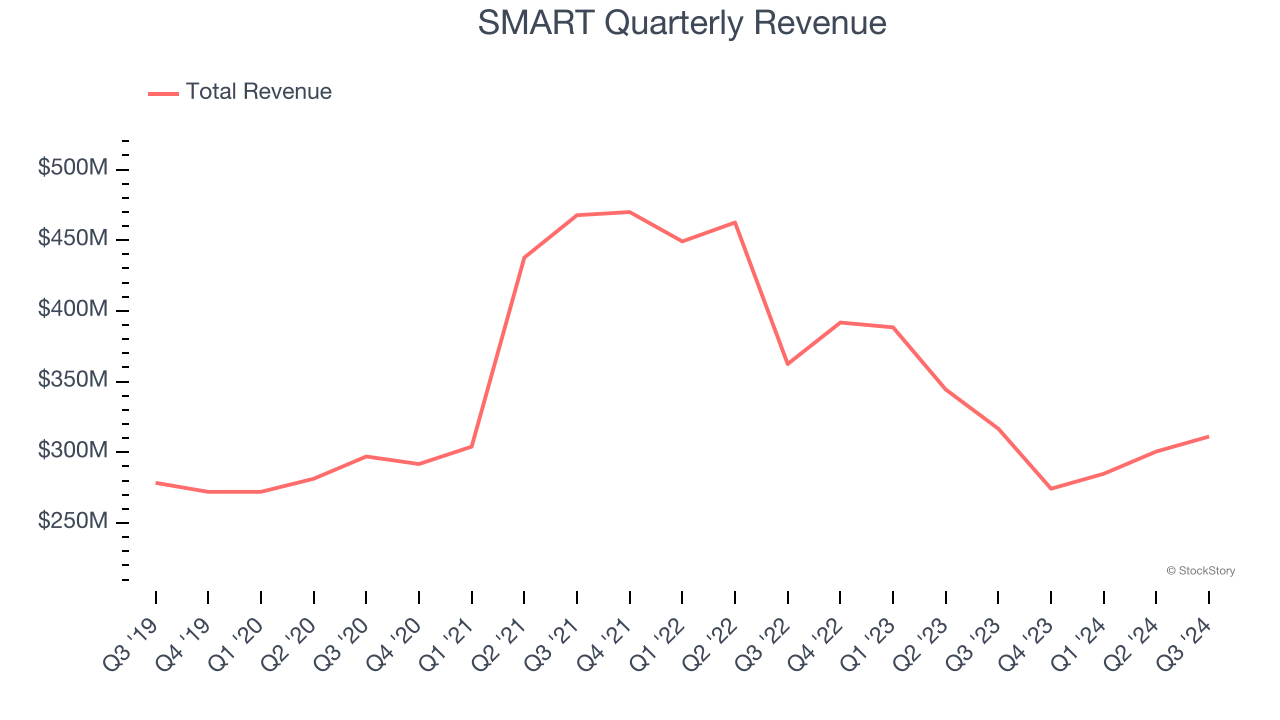
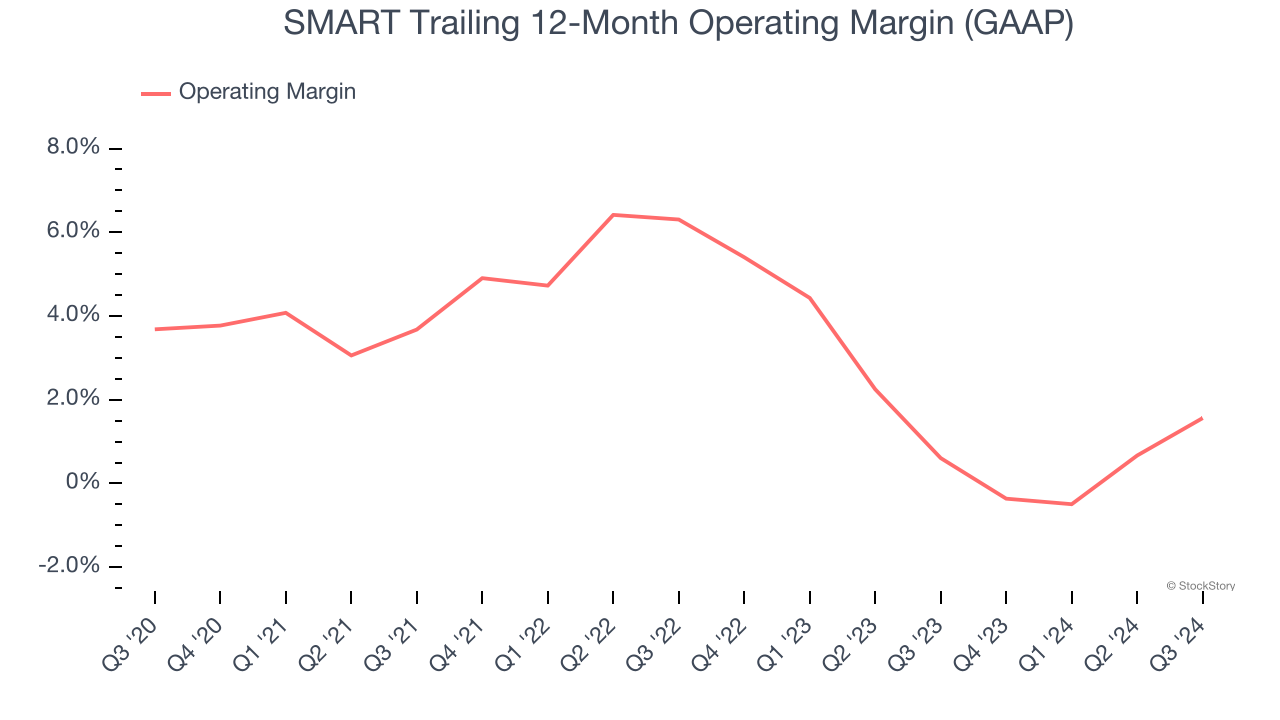
2. Weak Operating Margin Could Cause Trouble
Operating margin is one of the best measures of profitability because it tells us how much money a company takes home after procuring and manufacturing its products, marketing and selling those products, and most importantly, keeping them relevant through research and development.
SMART was profitable over the last two years but held back by its large cost base. Its average operating margin of 1% was among the worst in the semiconductor sector. This result isn’t too surprising given its low gross margin as a starting point.
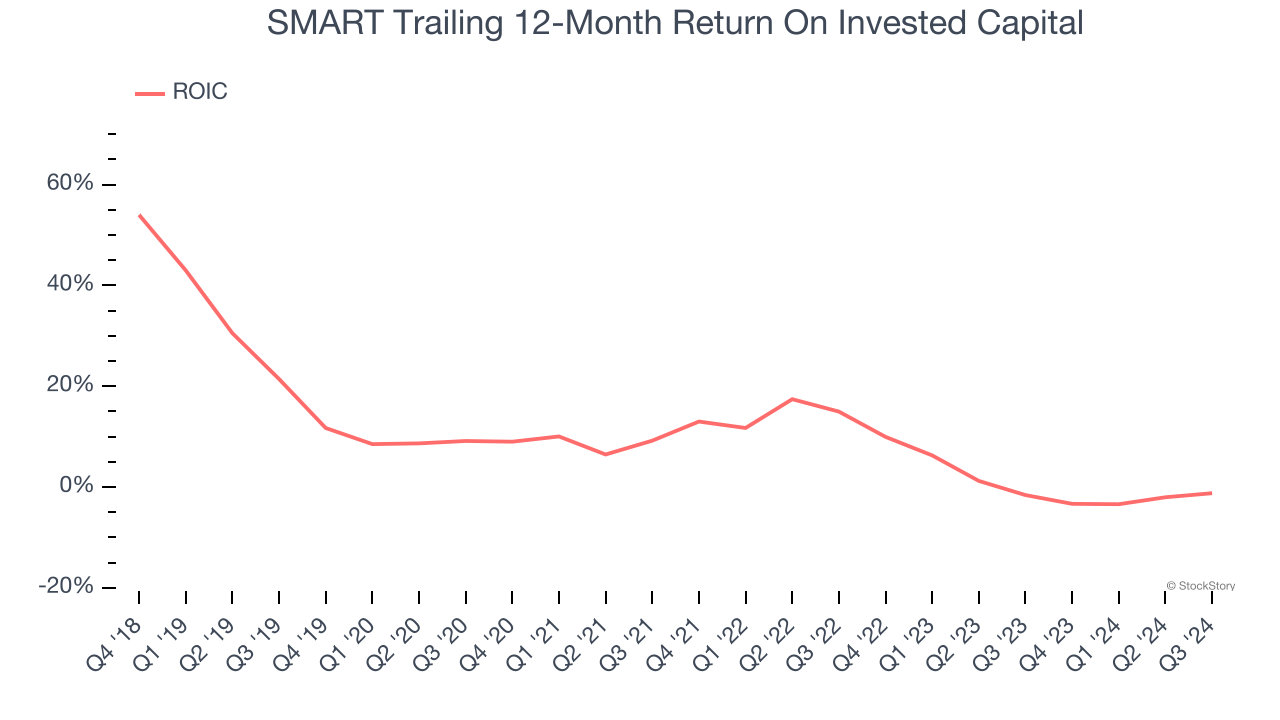
3. Previous Growth Initiatives Haven’t Paid Off Yet
Growth gives us insight into a company’s long-term potential, but how capital-efficient was that growth? Enter ROIC, a metric showing how much operating profit a company generates relative to the money it has raised (debt and equity).
SMART historically did a mediocre job investing in profitable growth initiatives. Its five-year average ROIC was 6.1%, somewhat low compared to the best semiconductor companies that consistently pump out 35%+.
Final Judgment
We cheer for all companies solving complex technology issues, but in the case of SMART, we’ll be cheering from the sidelines. With its shares lagging the market recently, the stock trades at 10.9× forward price-to-earnings (or $21 per share). This valuation tells us it’s a bit of a market darling with a lot of good news priced in - we think there are better stocks to buy right now. We’d recommend looking at one of Charlie Munger’s all-time favorite businesses.
Stocks We Would Buy Instead of SMART
The elections are now behind us. With rates dropping and inflation cooling, many analysts expect a breakout market - and we’re zeroing in on the stocks that could benefit immensely.
Take advantage of the rebound by checking out our Top 5 Growth Stocks for this month. This is a curated list of our High Quality stocks that have generated a market-beating return of 175% over the last five years.
Stocks that made our list in 2019 include now familiar names such as Nvidia (+2,183% between December 2019 and December 2024) as well as under-the-radar businesses like Sterling Infrastructure (+1,096% five-year return). Find your next big winner with StockStory today for free.


