
Let’s dig into the relative performance of Sleep Number (NASDAQ: SNBR) and its peers as we unravel the now-completed Q3 home furniture retailer earnings season.
Furniture retailers understand that ‘home is where the heart is’ but that no home is complete without that comfy sofa to kick back on or a dreamy bed to rest in. These stores focus on providing not only what is practically needed in a house but also aesthetics, style, and charm in the form of tables, lamps, and mirrors. Decades ago, it was thought that furniture would resist e-commerce because of the logistical challenges of shipping large furniture, but now you can buy a mattress online and get it in a box a few days later; so just like other retailers, furniture stores need to adapt to new realities and consumer behaviors.
The 4 home furniture retailer stocks we track reported a slower Q3. As a group, revenues missed analysts’ consensus estimates by 1.6% while next quarter’s revenue guidance was 8.9% below.
Luckily, home furniture retailer stocks have performed well with share prices up 25% on average since the latest earnings results.
Sleep Number (NASDAQ: SNBR)
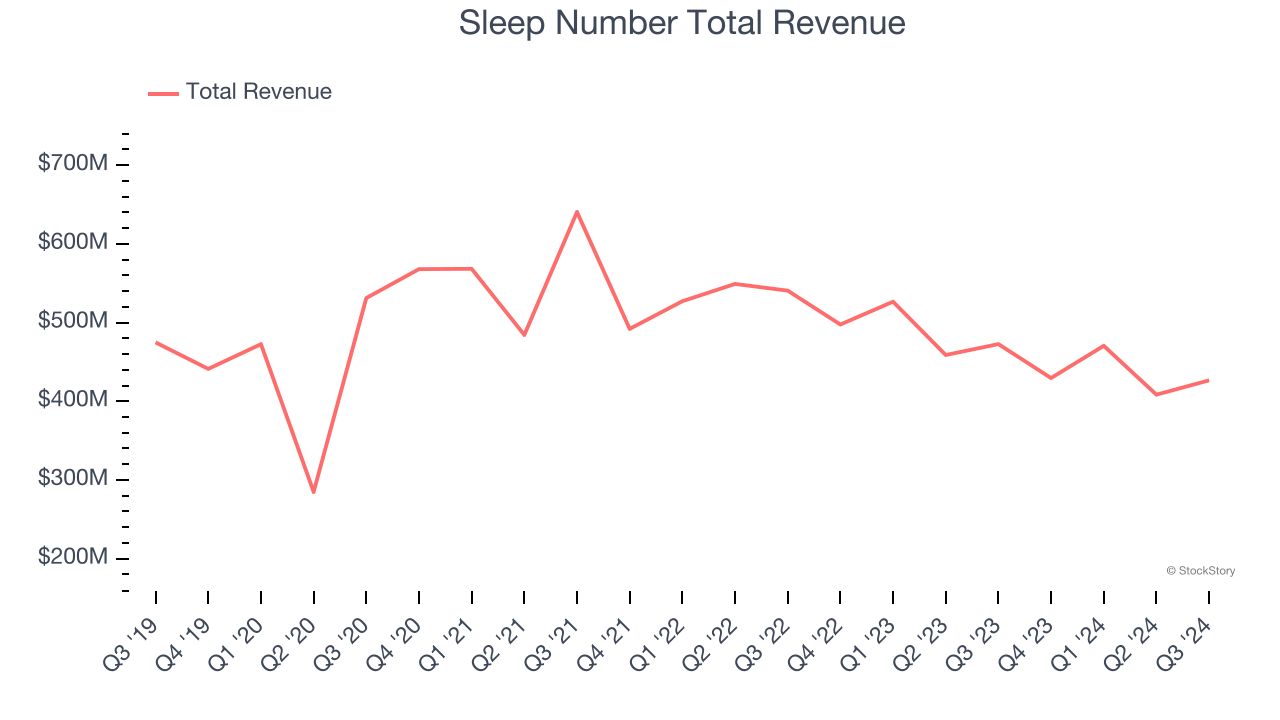
Known for mattresses that can be adjusted with regards to firmness, Sleep Number (NASDAQ: SNBR) manufactures and sells its own brand of bedding products such as mattresses, bed frames, and pillows.
Sleep Number reported revenues of $426.6 million, down 9.7% year on year. This print fell short of analysts’ expectations by 4.3%. Overall, it was a slower quarter for the company with full-year EBITDA guidance missing analysts’ expectations significantly.
“Our actions throughout the business over the past year are driving sustainable operating model improvements and contributing to our increased financial flexibility and durability. Our initiatives drove broad cost efficiencies and a gross margin rate improvement to 60.8%, resulting in third quarter adjusted EBITDA of $28 million, which was in-line with expectations even with persistent consumer demand weakness,” said Shelly Ibach, Chair, President and CEO.
Sleep Number delivered the weakest performance against analyst estimates and slowest revenue growth of the whole group. Interestingly, the stock is up 20.1% since reporting and currently trades at $15.90.
Read our full report on Sleep Number here, it’s free.
Best Q3: Williams-Sonoma (NYSE: WSM)
Started in 1956 as a store specializing in French cookware, Williams-Sonoma (NYSE: WSM) is a specialty retailer of higher-end kitchenware, home goods, and furniture.
Williams-Sonoma reported revenues of $1.80 billion, down 2.9% year on year, outperforming analysts’ expectations by 1.1%. The business had a strong quarter with a decent beat of analysts’ gross margin and EPS estimates.
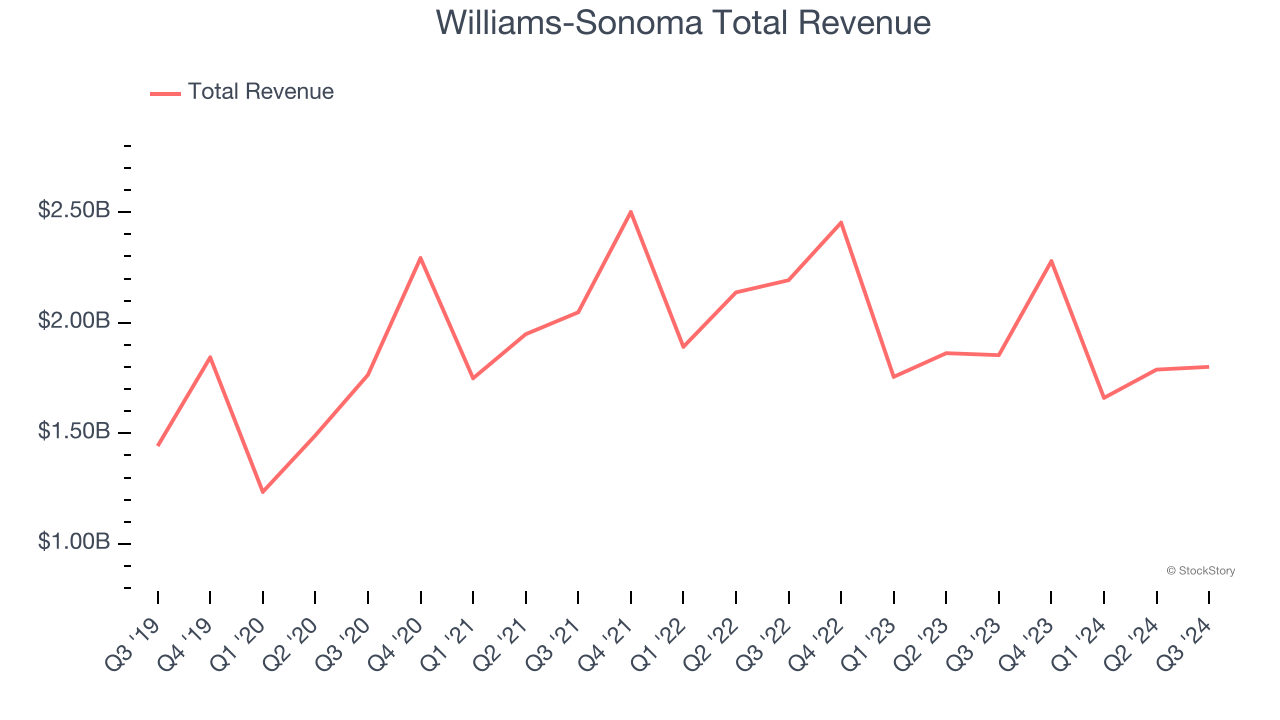
Williams-Sonoma delivered the biggest analyst estimates beat among its peers. The market seems happy with the results as the stock is up 51.6% since reporting. It currently trades at $208.
Is now the time to buy Williams-Sonoma? Access our full analysis of the earnings results here, it’s free.
Arhaus (NASDAQ: ARHS)
With an aesthetic that features natural materials such as reclaimed wood, Arhaus (NASDAQ: ARHS) is a high-end furniture retailer that sells everything from sofas to rugs to bookcases.
Arhaus reported revenues of $319.1 million, down 2.2% year on year, falling short of analysts’ expectations by 3.1%. It was a disappointing quarter as it posted full-year EBITDA guidance missing analysts’ expectations.
Interestingly, the stock is up 33.2% since the results and currently trades at $12.15.
Read our full analysis of Arhaus’s results here.
RH (NYSE: RH)
Formerly known as Restoration Hardware, RH (NYSE: RH) is a specialty retailer that exclusively sells its own brand of high-end furniture and home decor.
RH reported revenues of $811.7 million, up 8.1% year on year. This number met analysts’ expectations. Aside from that, it was a softer quarter as it recorded a significant miss of analysts’ EBITDA estimates and a significant miss of analysts’ gross margin estimates.
RH scored the fastest revenue growth among its peers. The stock is down 4.7% since reporting and currently trades at $363.01.
Read our full, actionable report on RH here, it’s free.
Want to invest in winners with rock-solid fundamentals? Check out our 9 Best Market-Beating Stocks and add them to your watchlist. These companies are poised for growth regardless of the political or macroeconomic climate.
Join Paid Stock Investor Research
Help us make StockStory more helpful to investors like yourself. Join our paid user research session and receive a $50 Amazon gift card for your opinions. Sign up here.


