Theater company AMC Entertainment (NYSE: AMC) announced better-than-expected revenue in Q4 CY2024, with sales up 18.3% year on year to $1.31 billion. Its non-GAAP loss of $0.18 per share was 10.2% below analysts’ consensus estimates.
Is now the time to buy AMC Entertainment? Find out by accessing our full research report, it’s free.
AMC Entertainment (AMC) Q4 CY2024 Highlights:
- Revenue: $1.31 billion vs analyst estimates of $1.29 billion (18.3% year-on-year growth, 1.6% beat)
- Adjusted EPS: -$0.18 vs analyst expectations of -$0.16 (10.2% miss)
- Adjusted EBITDA: $164.8 million vs analyst estimates of $128.8 million (12.6% margin, 27.9% beat)
- Operating Margin: 0.4%, up from -13.6% in the same quarter last year
- Free Cash Flow was $113.9 million, up from -$149.9 million in the same quarter last year
- Market Capitalization: $1.45 billion
Company Overview
With a profile that was raised due to meme stock mania beginning in 2021, AMC Entertainment (NYSE: AMC) operates movie theaters primarily in the US and Europe.
Leisure Facilities
Leisure facilities companies often sell experiences rather than tangible products, and in the last decade-plus, consumers have slowly shifted their spending from "things" to "experiences". Leisure facilities seek to benefit but must innovate to do so because of the industry's high competition and capital intensity.
Sales Growth
A company’s long-term performance is an indicator of its overall quality. While any business can experience short-term success, top-performing ones enjoy sustained growth for years. Over the last five years, AMC Entertainment’s demand was weak and its revenue declined by 3.3% per year. This was below our standards and is a sign of lacking business quality.
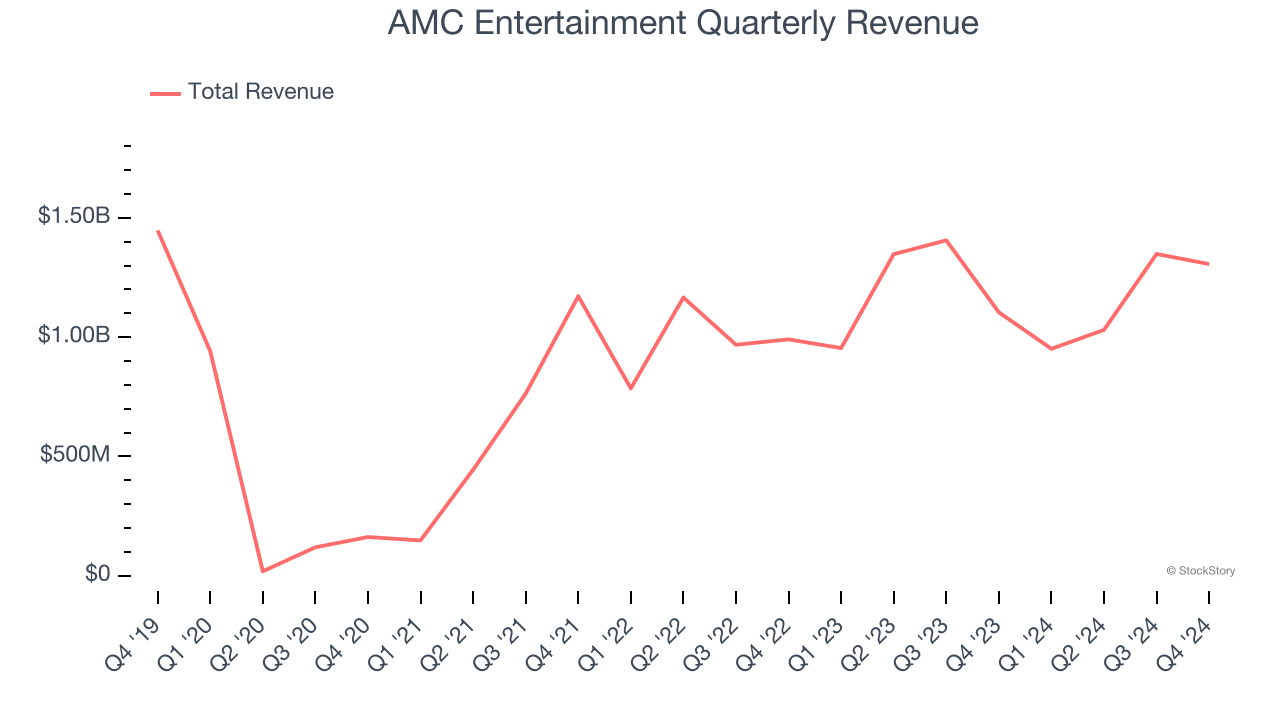
We at StockStory place the most emphasis on long-term growth, but within consumer discretionary, a stretched historical view may miss a company riding a successful new product or trend. AMC Entertainment’s annualized revenue growth of 8.9% over the last two years is above its five-year trend, but we were still disappointed by the results. Note that COVID hurt AMC Entertainment’s business in 2020 and part of 2021, and it bounced back in a big way thereafter. 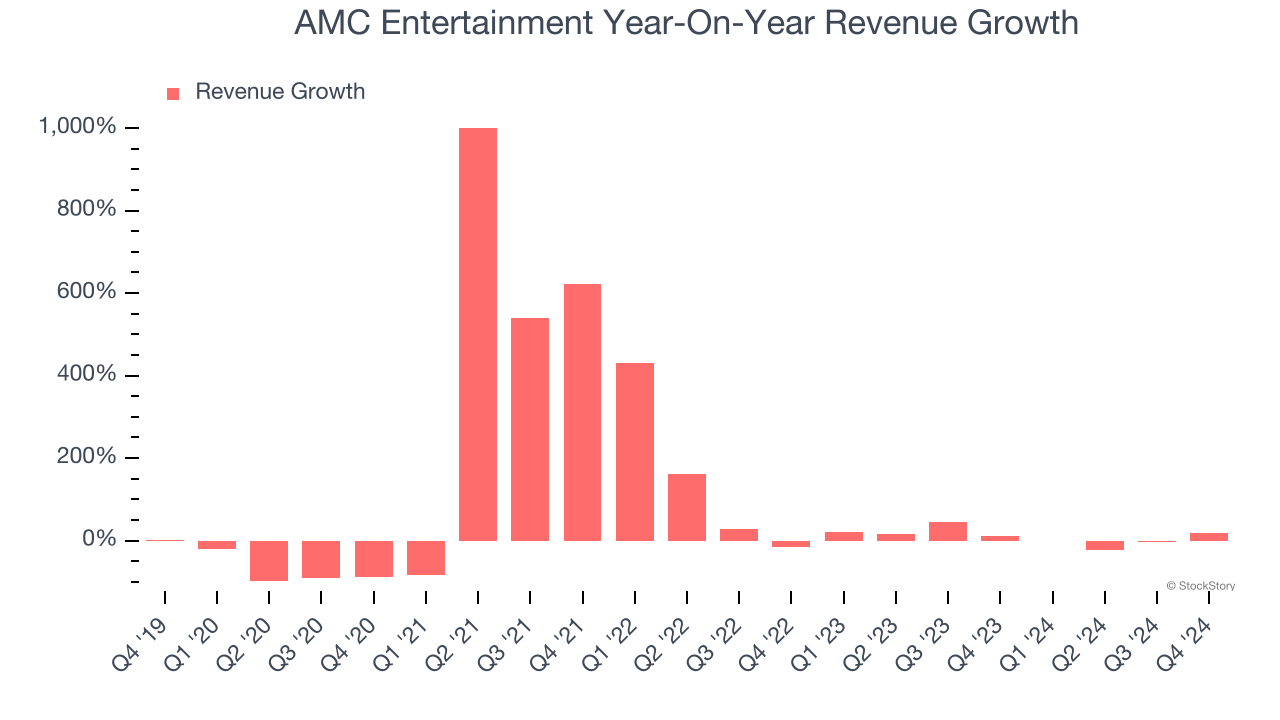
This quarter, AMC Entertainment reported year-on-year revenue growth of 18.3%, and its $1.31 billion of revenue exceeded Wall Street’s estimates by 1.6%.
Looking ahead, sell-side analysts expect revenue to grow 10.8% over the next 12 months. While this projection suggests its newer products and services will spur better top-line performance, it is still below average for the sector.
Unless you’ve been living under a rock, it should be obvious by now that generative AI is going to have a huge impact on how large corporations do business. While Nvidia and AMD are trading close to all-time highs, we prefer a lesser-known (but still profitable) stock benefiting from the rise of AI. Click here to access our free report one of our favorites growth stories.
Cash Is King
Free cash flow isn't a prominently featured metric in company financials and earnings releases, but we think it's telling because it accounts for all operating and capital expenses, making it tough to manipulate. Cash is king.
While AMC Entertainment posted positive free cash flow this quarter, the broader story hasn’t been so clean. Over the last two years, AMC Entertainment’s demanding reinvestments to stay relevant have drained its resources, putting it in a pinch and limiting its ability to return capital to investors. Its free cash flow margin averaged negative 7.8%, meaning it lit $7.80 of cash on fire for every $100 in revenue.
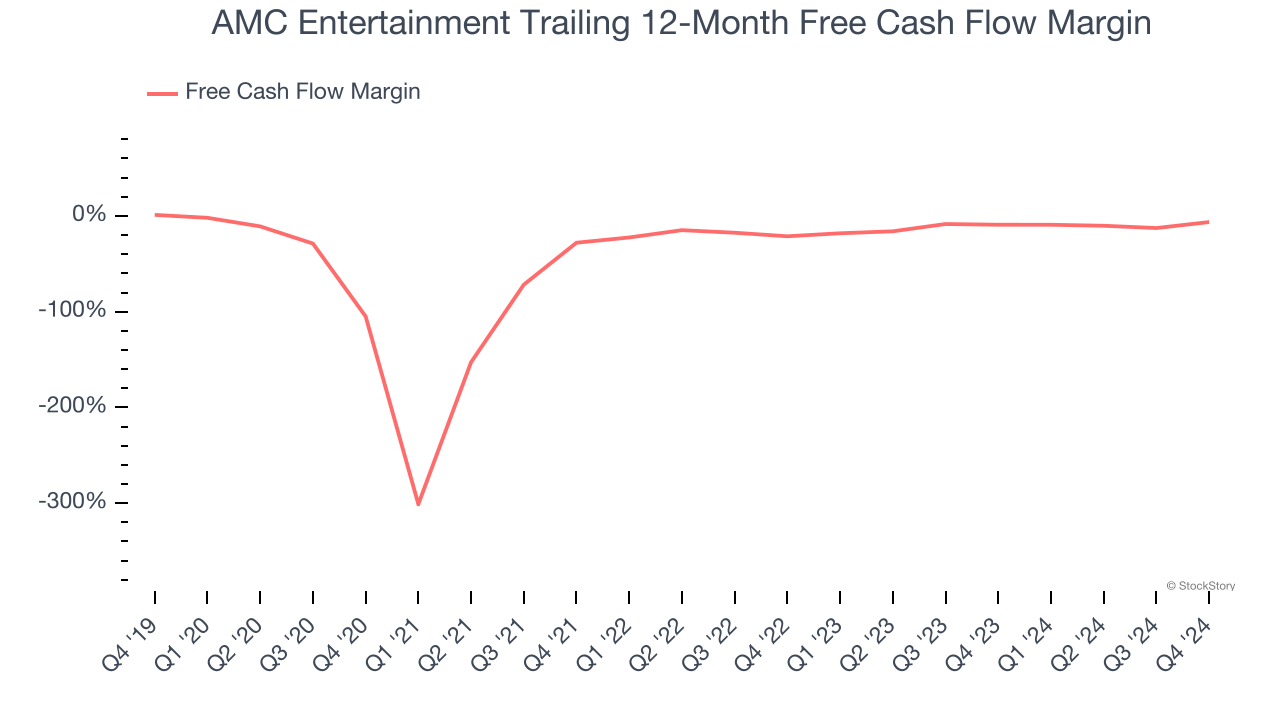
AMC Entertainment’s free cash flow clocked in at $113.9 million in Q4, equivalent to a 8.7% margin. Its cash flow turned positive after being negative in the same quarter last year, but we wouldn’t put too much weight on the short term because investment needs can be seasonal, causing temporary swings. Long-term trends are more important.
Over the next year, analysts predict AMC Entertainment will continue burning cash, albeit to a lesser extent. Their consensus estimates imply its free cash flow margin of negative 6.4% for the last 12 months will increase to negative 2.5%.
Key Takeaways from AMC Entertainment’s Q4 Results
We were impressed by how significantly AMC Entertainment blew past analysts’ EBITDA expectations this quarter. We were also happy its revenue outperformed Wall Street’s estimates. On the other hand, its EPS missed significantly. Zooming out, we think this was a decent quarter featuring some areas of strength but also some blemishes. The stock traded up 4.6% to $3.43 immediately following the results.
Should you buy the stock or not? What happened in the latest quarter matters, but not as much as longer-term business quality and valuation, when deciding whether to invest in this stock. We cover that in our actionable full research report which you can read here, it’s free.