Beer company Boston Beer (NYSE: SAM) reported Q4 CY2024 results exceeding the market’s revenue expectations, with sales up 2.2% year on year to $402.3 million. Its GAAP loss of $3.38 per share was significantly below analysts’ consensus estimates.
Is now the time to buy Boston Beer? Find out by accessing our full research report, it’s free.
Boston Beer (SAM) Q4 CY2024 Highlights:
- Revenue: $402.3 million vs analyst estimates of $391.2 million (2.2% year-on-year growth, 2.8% beat)
- EPS (GAAP): -$3.38 vs analyst estimates of -$1.51 (significant miss)
- Adjusted EBITDA: -$32.94 million vs analyst estimates of $1.54 million (-8.2% margin, significant miss)
- EPS (GAAP) guidance for the upcoming financial year 2025 is $9.25 at the midpoint, missing analyst estimates by 20.6%
- Operating Margin: -13.9%, down from -6.6% in the same quarter last year
- Free Cash Flow Margin: 4.6%, similar to the same quarter last year
- Market Capitalization: $2.65 billion
“The fourth quarter provided a solid finish to 2024 with flat depletions, gross margin expansion and strong cash generation,” said President and CEO Michael Spillane.
Company Overview
Known for its flavorful beverages challenging the status quo, Boston Beer (NYSE: SAM) is a pioneer in craft brewing and a symbol of American innovation in the alcoholic beverage industry.
Beverages, Alcohol, and Tobacco
These companies' performance is influenced by brand strength, marketing strategies, and shifts in consumer preferences. Changing consumption patterns are particularly relevant and can be seen in the rise of cannabis, craft beer, and vaping or the steady decline of soda and cigarettes. Companies that spend on innovation to meet consumers where they are with regards to trends can reap huge demand benefits while those who ignore trends can see stagnant volumes. Finally, with the advent of the social media, the cost of starting a brand from scratch is much lower, meaning that new entrants can chip away at the market shares of established players.
Sales Growth
Examining a company’s long-term performance can provide clues about its quality. Any business can put up a good quarter or two, but the best consistently grow over the long haul.
With $2.01 billion in revenue over the past 12 months, Boston Beer is a small consumer staples company, which sometimes brings disadvantages compared to larger competitors benefiting from economies of scale and negotiating leverage with retailers.
As you can see below, Boston Beer struggled to increase demand as its $2.01 billion of sales for the trailing 12 months was close to its revenue three years ago. This shows demand was soft, a poor baseline for our analysis.
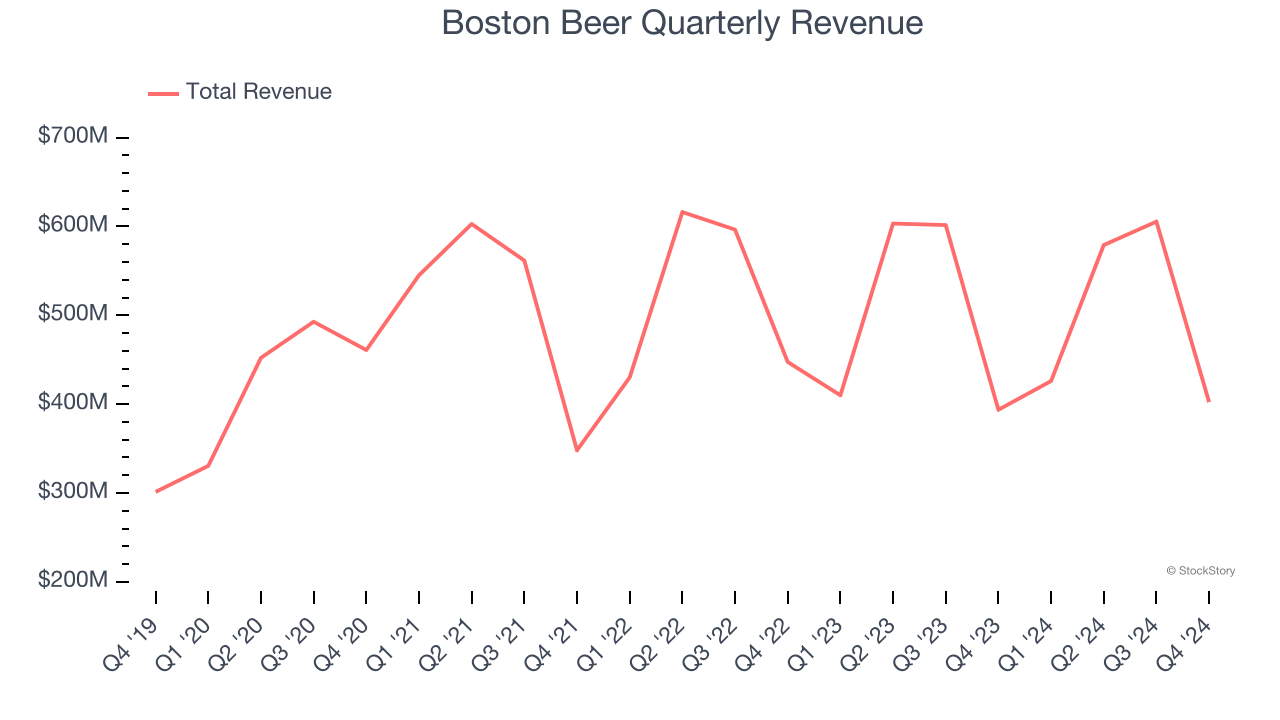
This quarter, Boston Beer reported modest year-on-year revenue growth of 2.2% but beat Wall Street’s estimates by 2.8%.
Looking ahead, sell-side analysts expect revenue to grow 1.3% over the next 12 months. Although this projection suggests its newer products will fuel better top-line performance, it is still below average for the sector.
Software is eating the world and there is virtually no industry left that has been untouched by it. That drives increasing demand for tools helping software developers do their jobs, whether it be monitoring critical cloud infrastructure, integrating audio and video functionality, or ensuring smooth content streaming. Click here to access a free report on our 3 favorite stocks to play this generational megatrend.
Cash Is King
Free cash flow isn't a prominently featured metric in company financials and earnings releases, but we think it's telling because it accounts for all operating and capital expenses, making it tough to manipulate. Cash is king.
Boston Beer has shown robust cash profitability, driven by its attractive business model that enables it to reinvest or return capital to investors. The company’s free cash flow margin averaged 9.3% over the last two years, quite impressive for a consumer staples business. The divergence from its underwhelming operating margin stems from the add-back of non-cash charges like depreciation and stock-based compensation. GAAP operating profit expenses these line items, but free cash flow does not.
Taking a step back, we can see that Boston Beer’s margin dropped by 1.4 percentage points over the last year. If its declines continue, it could signal higher capital intensity.
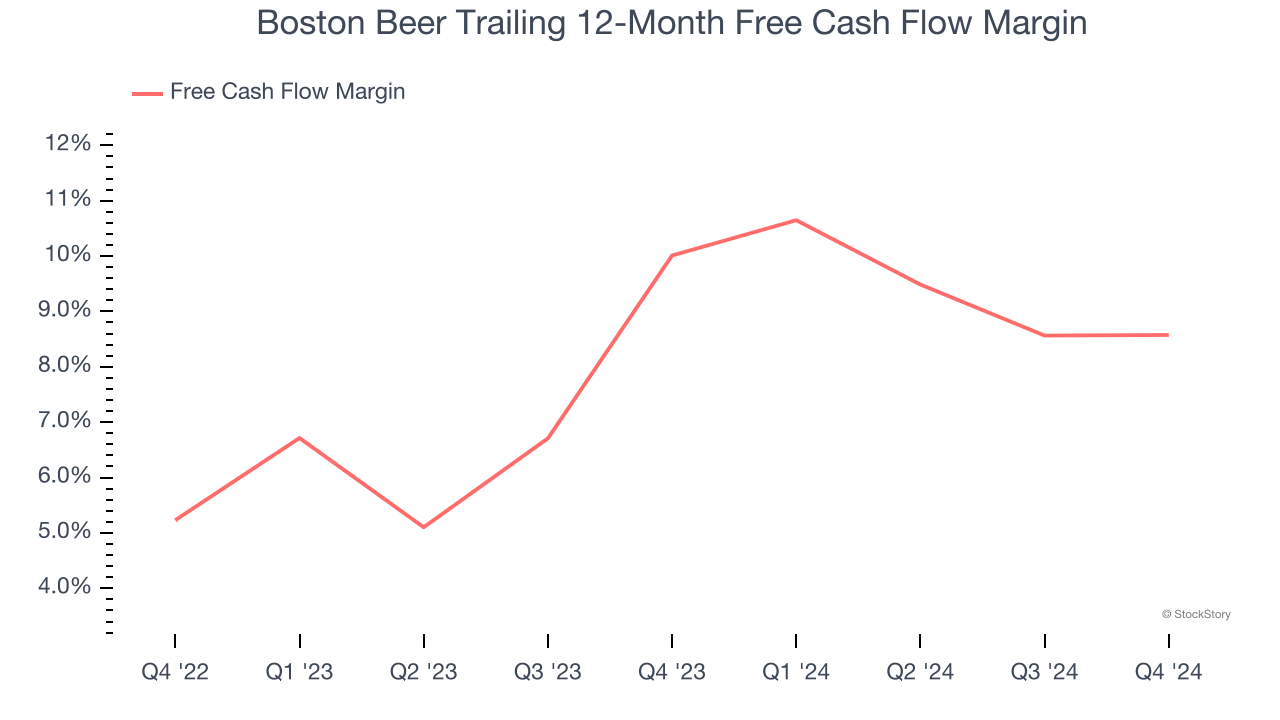
Boston Beer’s free cash flow clocked in at $18.4 million in Q4, equivalent to a 4.6% margin. This cash profitability was in line with the comparable period last year but below its two-year average. In a silo, this isn’t a big deal because investment needs can be seasonal, but we’ll be watching to see if the trend extrapolates into future quarters.
Key Takeaways from Boston Beer’s Q4 Results
It was encouraging to see Boston Beer beat analysts’ revenue expectations this quarter. We were also happy its gross margin outperformed Wall Street’s estimates. On the other hand, its EPS and full-year EPS guidance fell short. Overall, this was a weaker quarter, but the stock traded up 4.6% to $245 immediately following the results.
Is Boston Beer an attractive investment opportunity right now? What happened in the latest quarter matters, but not as much as longer-term business quality and valuation, when deciding whether to invest in this stock. We cover that in our actionable full research report which you can read here, it’s free.