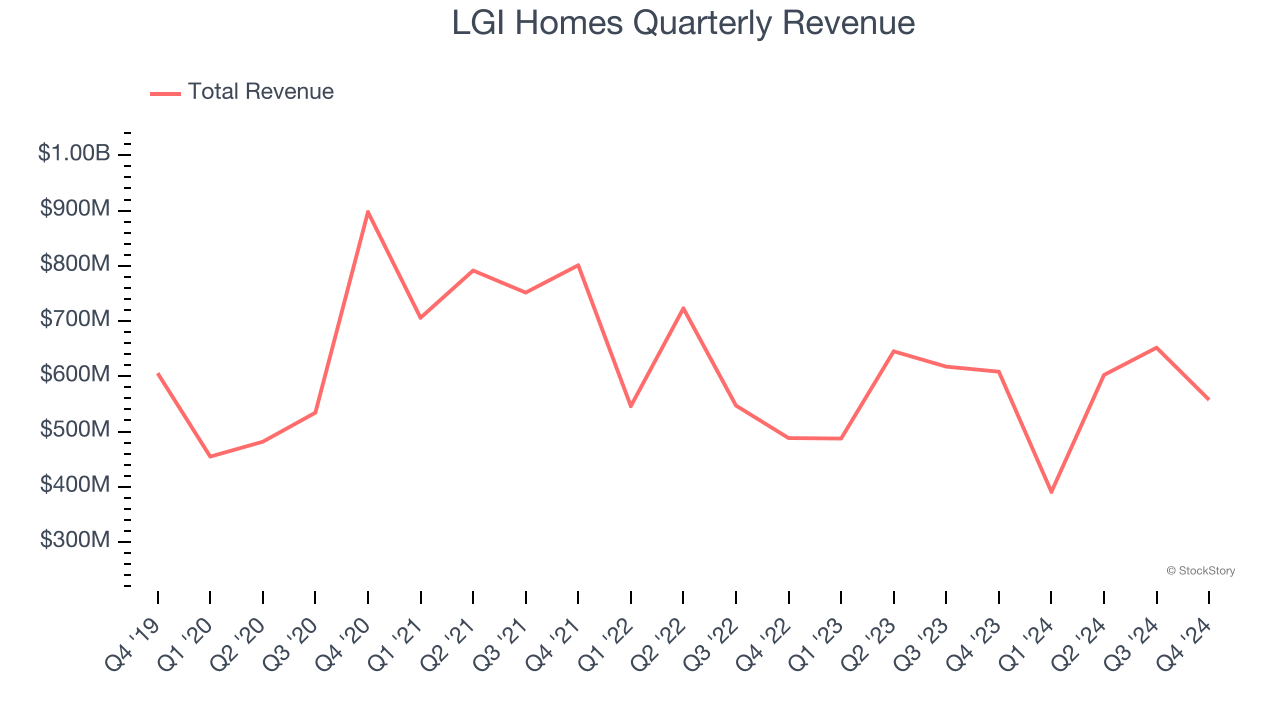
Affordable single-family home construction company LGI Homes (NASDAQ: LGIH) missed Wall Street’s revenue expectations in Q4 CY2024, with sales falling 8.4% year on year to $557.4 million. Its GAAP profit of $2.15 per share was in line with analysts’ consensus estimates.
Is now the time to buy LGI Homes? Find out by accessing our full research report, it’s free.
LGI Homes (LGIH) Q4 CY2024 Highlights:
- Revenue: $557.4 million vs analyst estimates of $626.4 million (8.4% year-on-year decline, 11% miss)
- EPS (GAAP): $2.15 vs analyst estimates of $2.15 (in line)
- Operating Margin: 8.2%, down from 9.8% in the same quarter last year
- Backlog: $236.5 million at quarter end, up 5.2% year on year
- Market Capitalization: $1.79 billion
“In the face of a mixed macroeconomic backdrop, our strong finish in the fourth quarter enabled us to meet, and in many cases exceed, our strategic goals for 2024,” said Eric Lipar, Chairman and Chief Executive Officer of LGI Homes.
Company Overview
Based in Texas, LGI Homes (NASDAQ: LGIH) is a homebuilding company specializing in constructing affordable, entry-level single-family homes in desirable communities across the United States.
Home Builders
Traditionally, homebuilders have built competitive advantages with economies of scale that lead to advantaged purchasing and brand recognition among consumers. Aesthetic trends have always been important in the space, but more recently, energy efficiency and conservation are driving innovation. However, these companies are still at the whim of the macro, specifically interest rates that heavily impact new and existing home sales. In fact, homebuilders are one of the most cyclical subsectors within industrials.
Sales Growth
Reviewing a company’s long-term sales performance reveals insights into its quality. Any business can have short-term success, but a top-tier one grows for years. Over the last five years, LGI Homes grew its sales at a sluggish 3.7% compounded annual growth rate. This fell short of our benchmark for the industrials sector and is a rough starting point for our analysis.
We at StockStory place the most emphasis on long-term growth, but within industrials, a half-decade historical view may miss cycles, industry trends, or a company capitalizing on catalysts such as a new contract win or a successful product line. LGI Homes’s history shows it grew in the past but relinquished its gains over the last two years, as its revenue fell by 2.2% annually. 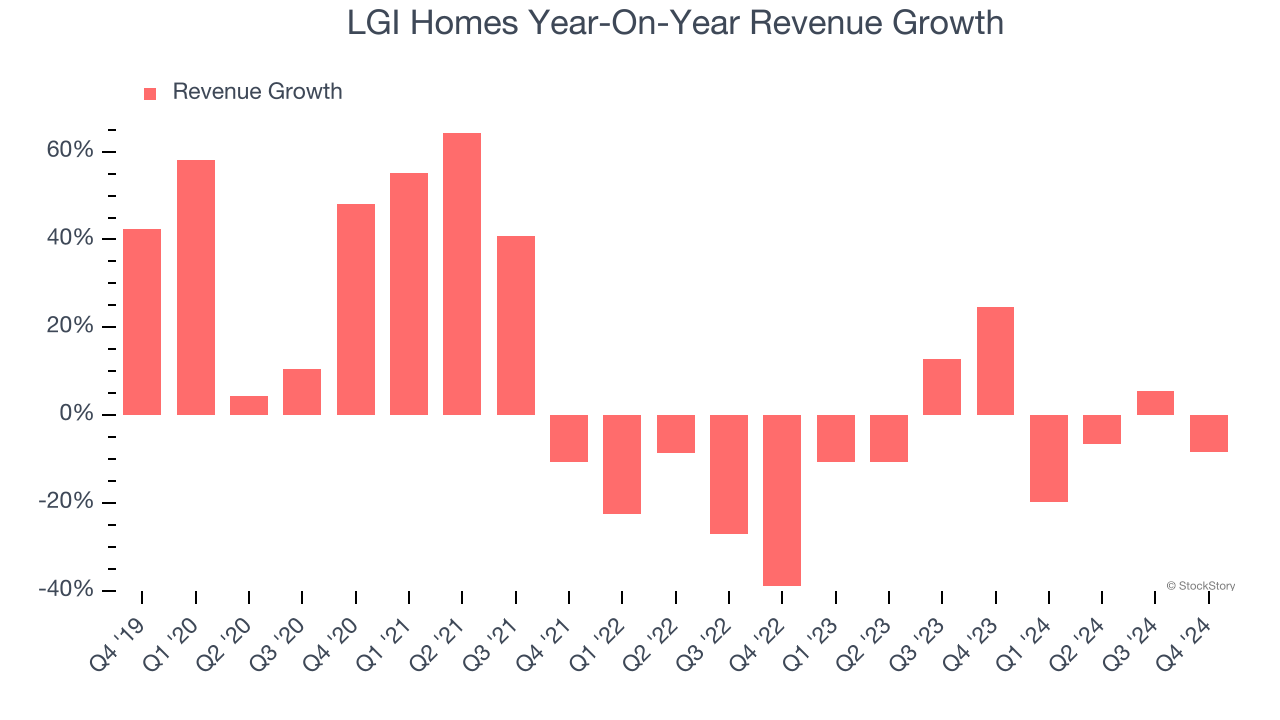
We can dig further into the company’s revenue dynamics by analyzing its backlog, or the value of its outstanding orders that have not yet been executed or delivered. LGI Homes’s backlog reached $236.5 million in the latest quarter and averaged 3.4% year-on-year growth over the last two years. Because this number is better than its revenue growth, we can see the company accumulated more orders than it could fulfill and deferred revenue to the future. This could imply elevated demand for LGI Homes’s products and services but raises concerns about capacity constraints. 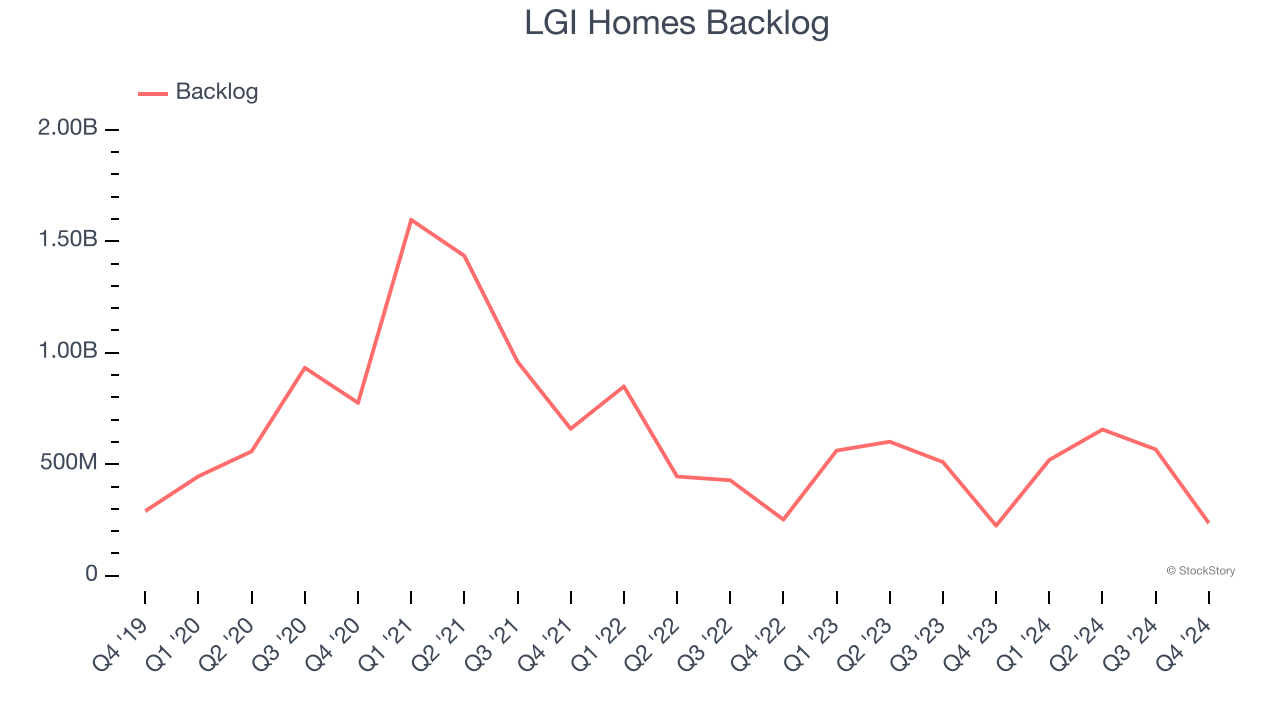
This quarter, LGI Homes missed Wall Street’s estimates and reported a rather uninspiring 8.4% year-on-year revenue decline, generating $557.4 million of revenue.
Looking ahead, sell-side analysts expect revenue to grow 26.1% over the next 12 months, an improvement versus the last two years. This projection is eye-popping and indicates its newer products and services will catalyze better top-line performance.
Unless you’ve been living under a rock, it should be obvious by now that generative AI is going to have a huge impact on how large corporations do business. While Nvidia and AMD are trading close to all-time highs, we prefer a lesser-known (but still profitable) stock benefiting from the rise of AI. Click here to access our free report one of our favorites growth stories.
Operating Margin
LGI Homes has been an efficient company over the last five years. It was one of the more profitable businesses in the industrials sector, boasting an average operating margin of 14.2%. This result was particularly impressive because of its low gross margin, which is mostly a factor of what it sells and takes huge shifts to move meaningfully. Companies have more control over their operating margins, and it’s a show of well-managed operations if they’re high when gross margins are low.
Looking at the trend in its profitability, LGI Homes’s operating margin decreased by 5.8 percentage points over the last five years. This raises an eyebrow about the company’s expense base because its revenue growth should have given it leverage on its fixed costs, resulting in better economies of scale and profitability.
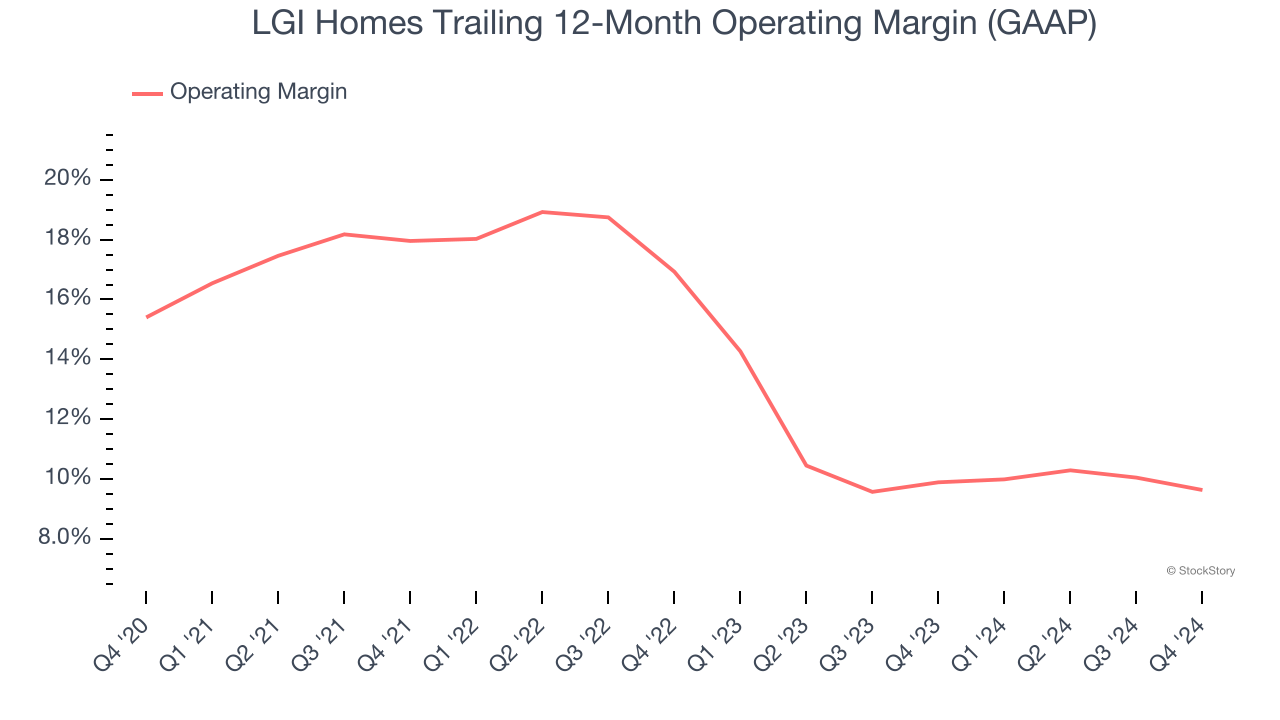
This quarter, LGI Homes generated an operating profit margin of 8.2%, down 1.7 percentage points year on year. Since LGI Homes’s operating margin decreased more than its gross margin, we can assume it was recently less efficient because expenses such as marketing, R&D, and administrative overhead increased.
Earnings Per Share
Revenue trends explain a company’s historical growth, but the long-term change in earnings per share (EPS) points to the profitability of that growth – for example, a company could inflate its sales through excessive spending on advertising and promotions.
LGI Homes’s weak 3.5% annual EPS growth over the last five years aligns with its revenue performance. This tells us it maintained its per-share profitability as it expanded.
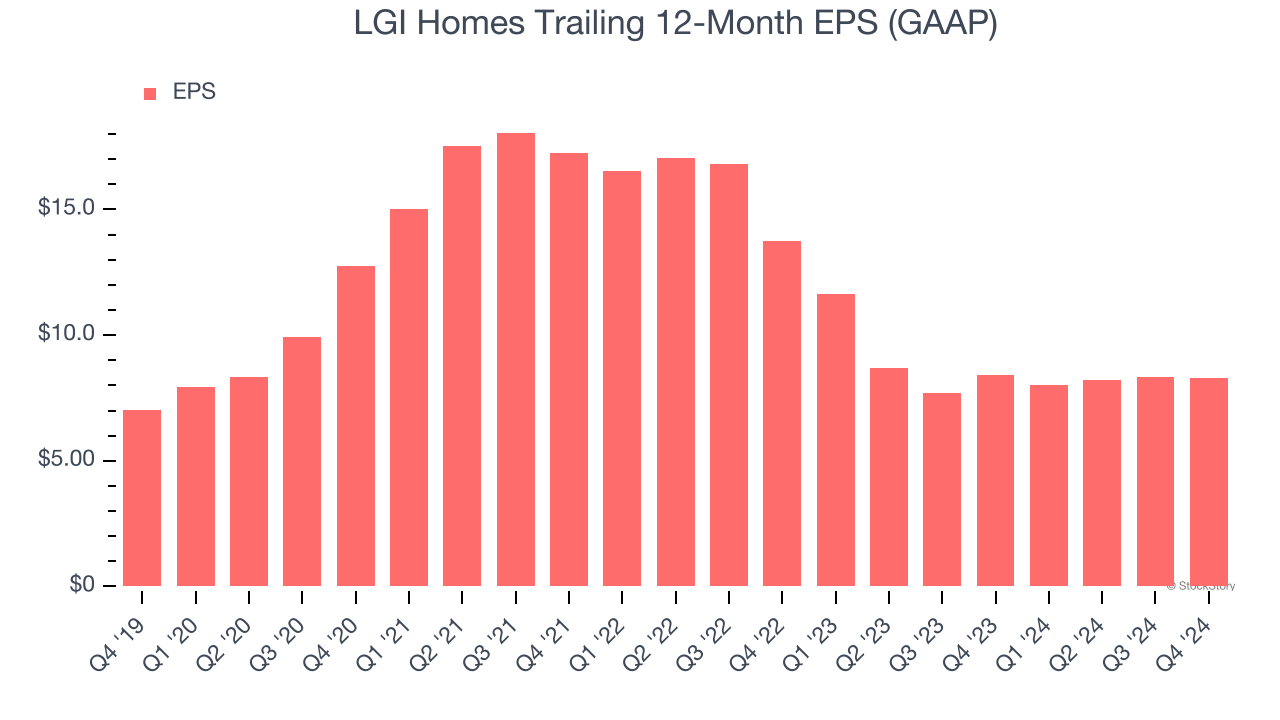
Like with revenue, we analyze EPS over a more recent period because it can provide insight into an emerging theme or development for the business.
For LGI Homes, its two-year annual EPS declines of 22.3% show it’s continued to underperform. These results were bad no matter how you slice the data.
In Q4, LGI Homes reported EPS at $2.15, down from $2.19 in the same quarter last year. This print was close to analysts’ estimates. Over the next 12 months, Wall Street expects LGI Homes’s full-year EPS of $8.30 to grow 23.2%.
Key Takeaways from LGI Homes’s Q4 Results
We struggled to find many positives in these results as its revenue and backlog fell short of Wall Street’s estimates. The backlog is particularly important because it is a leading indicator of demand. Overall, this was a weaker quarter. The stock traded down 3.7% to $73.15 immediately following the results.
LGI Homes’s latest earnings report disappointed. One quarter doesn’t define a company’s quality, so let’s explore whether the stock is a buy at the current price. We think that the latest quarter is only one piece of the longer-term business quality puzzle. Quality, when combined with valuation, can help determine if the stock is a buy. We cover that in our actionable full research report which you can read here, it’s free.