
Casual restaurant chain Portillo’s (NASDAQ: PTLO) met Wall Street’s revenue expectations in Q4 CY2024, but sales fell by 1.7% year on year to $184.6 million. Its GAAP profit of $0.17 per share was significantly above analysts’ consensus estimates.
Is now the time to buy Portillo's? Find out by accessing our full research report, it’s free.
Portillo's (PTLO) Q4 CY2024 Highlights:
- Revenue: $184.6 million vs analyst estimates of $185.1 million (1.7% year-on-year decline, in line)
- EPS (GAAP): $0.17 vs analyst estimates of $0.04 (significant beat)
- Adjusted EBITDA: $25.21 million vs analyst estimates of $24.09 million (13.7% margin, 4.6% beat)
- Operating Margin: 7.5%, in line with the same quarter last year
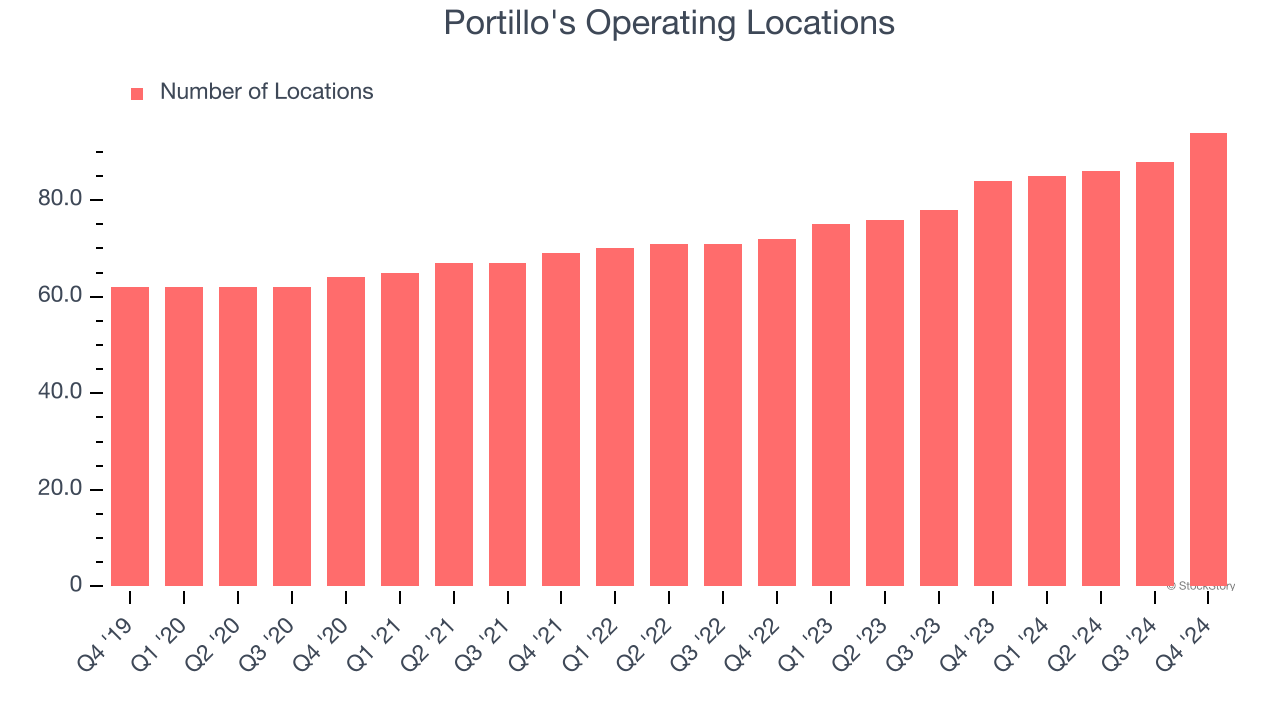
- Locations: 94 at quarter end, up from 84 in the same quarter last year
- Same-Store Sales were flat year on year (4.4% in the same quarter last year)
- Market Capitalization: $850.1 million
“We ended the year with solid momentum, supported by key initiatives that will drive our long-term growth,” said Michael Osanloo, President and Chief Executive Officer of Portillo’s.
Company Overview
Begun as a Chicago hot dog stand in 1963, Portillo’s (NASDAQ: PTLO) is a casual restaurant chain that serves Chicago-style hot dogs and beef sandwiches as well as fries and shakes.
Traditional Fast Food
Traditional fast-food restaurants are renowned for their speed and convenience, boasting menus filled with familiar and budget-friendly items. Their reputations for on-the-go consumption make them favored destinations for individuals and families needing a quick meal. This class of restaurants, however, is fighting the perception that their meals are unhealthy and made with inferior ingredients, a battle that's especially relevant today given the consumers increasing focus on health and wellness.
Sales Growth
Examining a company’s long-term performance can provide clues about its quality. Any business can put up a good quarter or two, but the best consistently grow over the long haul.
With $710.6 million in revenue over the past 12 months, Portillo's is a small restaurant chain, which sometimes brings disadvantages compared to larger competitors benefiting from better brand awareness and economies of scale. On the other hand, it can grow faster because it’s working from a smaller revenue base and has more white space to build new restaurants.
As you can see below, Portillo's grew its sales at a decent 8.2% compounded annual growth rate over the last five years (we compare to 2019 to normalize for COVID-19 impacts) as it opened new restaurants and increased sales at existing, established dining locations.
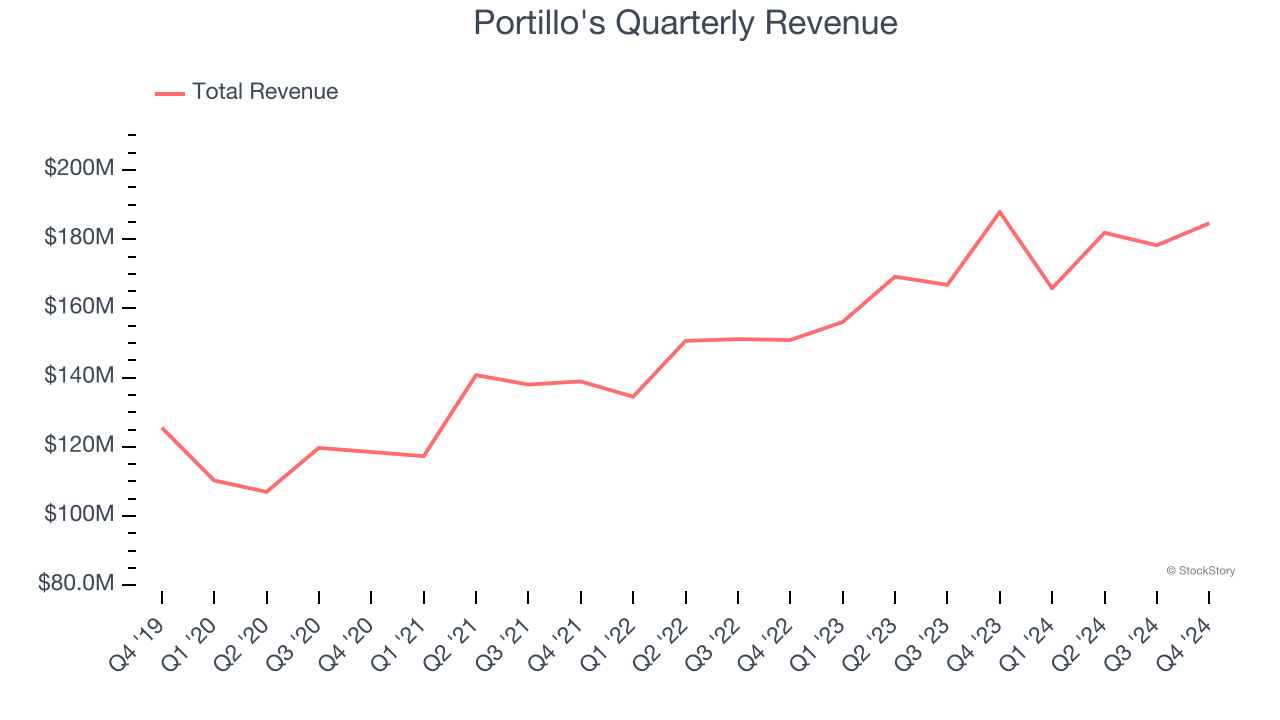
This quarter, Portillo's reported a rather uninspiring 1.7% year-on-year revenue decline to $184.6 million of revenue, in line with Wall Street’s estimates.
Looking ahead, sell-side analysts expect revenue to grow 11.2% over the next 12 months, an acceleration versus the last five years. This projection is healthy and indicates its newer menu offerings will spur better top-line performance.
Software is eating the world and there is virtually no industry left that has been untouched by it. That drives increasing demand for tools helping software developers do their jobs, whether it be monitoring critical cloud infrastructure, integrating audio and video functionality, or ensuring smooth content streaming. Click here to access a free report on our 3 favorite stocks to play this generational megatrend.
Restaurant Performance
Number of Restaurants
Portillo's operated 94 locations in the latest quarter. It has opened new restaurants at a rapid clip over the last two years, averaging 11.5% annual growth, much faster than the broader restaurant sector. This gives it a chance to scale into a mid-sized business over time.
When a chain opens new restaurants, it usually means it’s investing for growth because there’s healthy demand for its meals and there are markets where its concepts have few or no locations.
Same-Store Sales
The change in a company's restaurant base only tells one side of the story. The other is the performance of its existing locations, which informs management teams whether they should expand or downsize their physical footprints. Same-store sales is an industry measure of whether revenue is growing at those existing restaurants and is driven by customer visits (often called traffic) and the average spending per customer (ticket).
Portillo’s demand has been healthy for a restaurant chain over the last two years. On average, the company has grown its same-store sales by a robust 2.6% per year. This performance gives it the confidence to meaningfully expand its restaurant base.
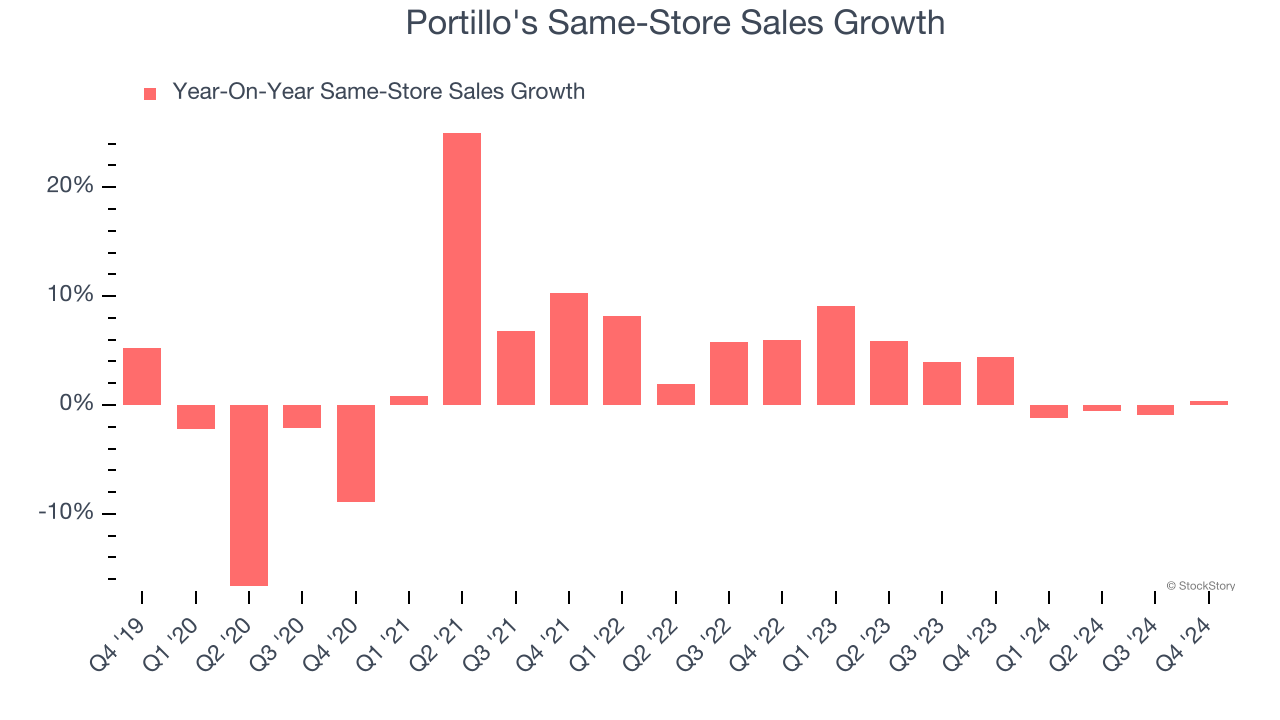
In the latest quarter, Portillo’s year on year same-store sales were flat. This was a meaningful deceleration from its historical levels. We’ll be watching closely to see if Portillo's can reaccelerate growth.
Key Takeaways from Portillo’s Q4 Results
We were impressed by how significantly Portillo's blew past analysts’ EPS expectations this quarter despite in-line revenue. EBITDA also outperformed Wall Street’s estimates, showing that profitability was better than expected. Overall, we think this was a solid quarter with some key areas of upside. The stock traded up 6.7% to $14.50 immediately after reporting.
Portillo's had an encouraging quarter, but one earnings result doesn’t necessarily make the stock a buy. Let’s see if this is a good investment. If you’re making that decision, you should consider the bigger picture of valuation, business qualities, as well as the latest earnings. We cover that in our actionable full research report which you can read here, it’s free.


