
Radiopharmaceutical company Lantheus Holdings (NASDAQ: LNTH) reported Q4 CY2024 results topping the market’s revenue expectations, with sales up 10.5% year on year to $391.1 million. On the other hand, the company’s full-year revenue guidance of $1.58 billion at the midpoint came in 2.3% below analysts’ estimates. Its non-GAAP profit of $1.59 per share was 3% above analysts’ consensus estimates.
Is now the time to buy Lantheus? Find out by accessing our full research report, it’s free.
Lantheus (LNTH) Q4 CY2024 Highlights:
- Revenue: $391.1 million vs analyst estimates of $377.1 million (10.5% year-on-year growth, 3.7% beat)
- Adjusted EPS: $1.59 vs analyst estimates of $1.54 (3% beat)
- Management’s revenue guidance for the upcoming financial year 2025 is $1.58 billion at the midpoint, missing analyst estimates by 2.3% and implying 2.8% growth (vs 18.6% in FY2024)
- Adjusted EPS guidance for the upcoming financial year 2025 is $7.10 at the midpoint, beating analyst estimates by 1.7%
- Operating Margin: 29.1%, down from 38.8% in the same quarter last year
- Free Cash Flow Margin: 36.1%, up from 28.3% in the same quarter last year
- Market Capitalization: $5.57 billion
“2024 was a groundbreaking year for Lantheus, as our radiodiagnostic, PYLARIFY, reached blockbuster status, and we enhanced our radiopharmaceutical leadership,” said Brian Markison, Chief Executive Officer at Lantheus.
Company Overview
Founded in 1956, Lantheus Holdings (NASDAQ: LNTH) develops and commercializes innovative diagnostic and therapeutic radiopharmaceuticals for healthcare providers, with a focus on oncology, cardiology, and neurology.
Medical Devices & Supplies - Imaging, Diagnostics
The medical devices and supplies industry, particularly those specializing in imaging and diagnostics, operates with a comparatively stable yet capital-intensive business model. Companies in this space benefit from consistent demand driven by the essential nature of diagnostic tools in patient care, as well as recurring revenue streams from consumables, service contracts, and equipment maintenance. However, the industry faces challenges such as significant upfront development costs, stringent regulatory requirements, and pricing pressures from hospitals and healthcare systems, which are increasingly focused on cost containment. Looking ahead, the industry should enjoy tailwinds from advancements in technology, including the integration of artificial intelligence to enhance diagnostic accuracy and workflow efficiency, as well as rising demand for imaging solutions driven by aging populations. On the other hand, headwinds could arise from a rethinking of healthcare costs potentially resulting in reimbursement cuts and slower capital equipment purchasing. Additionally, cybersecurity concerns surrounding connected medical devices could introduce new risks and complexities for manufacturers.
Sales Growth
A company’s long-term sales performance is one signal of its overall quality. Even a bad business can shine for one or two quarters, but a top-tier one grows for years. Over the last five years, Lantheus grew its sales at an incredible 34.6% compounded annual growth rate. Its growth surpassed the average healthcare company and shows its offerings resonate with customers, a great starting point for our analysis.
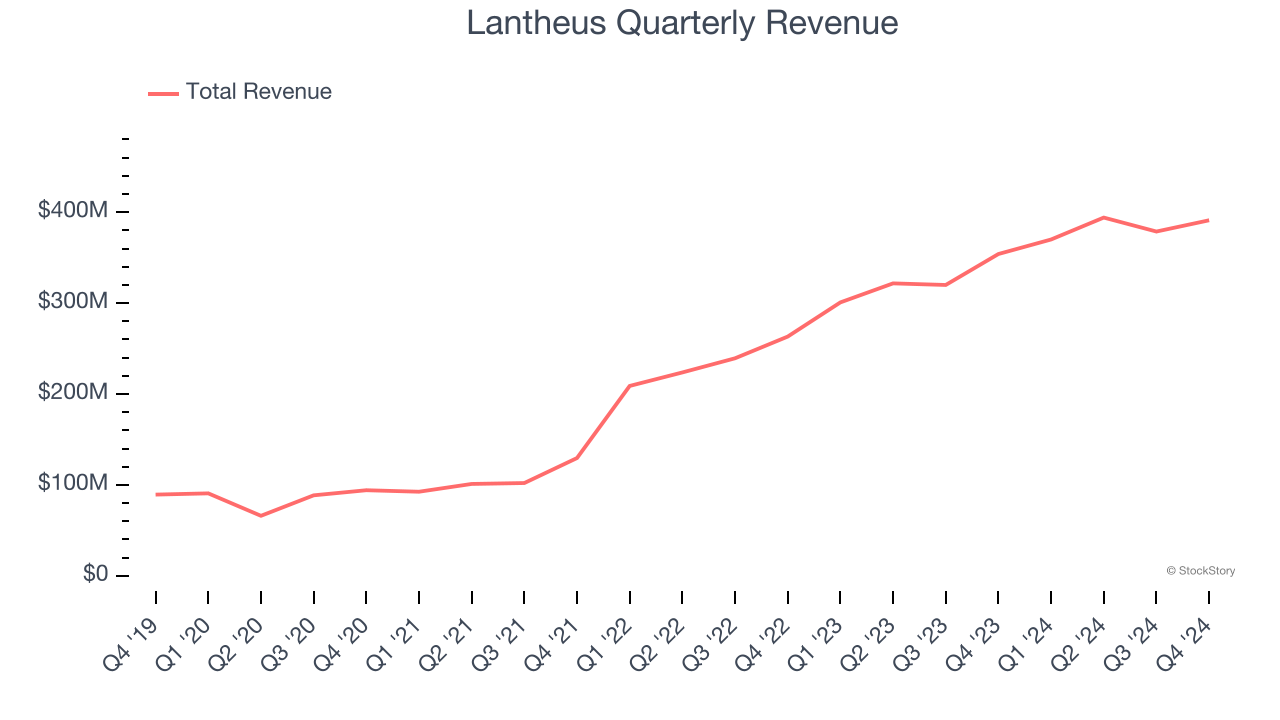
Long-term growth is the most important, but within healthcare, a half-decade historical view may miss new innovations or demand cycles. Lantheus’s annualized revenue growth of 28.1% over the last two years is below its five-year trend, but we still think the results were good and suggest demand was strong. 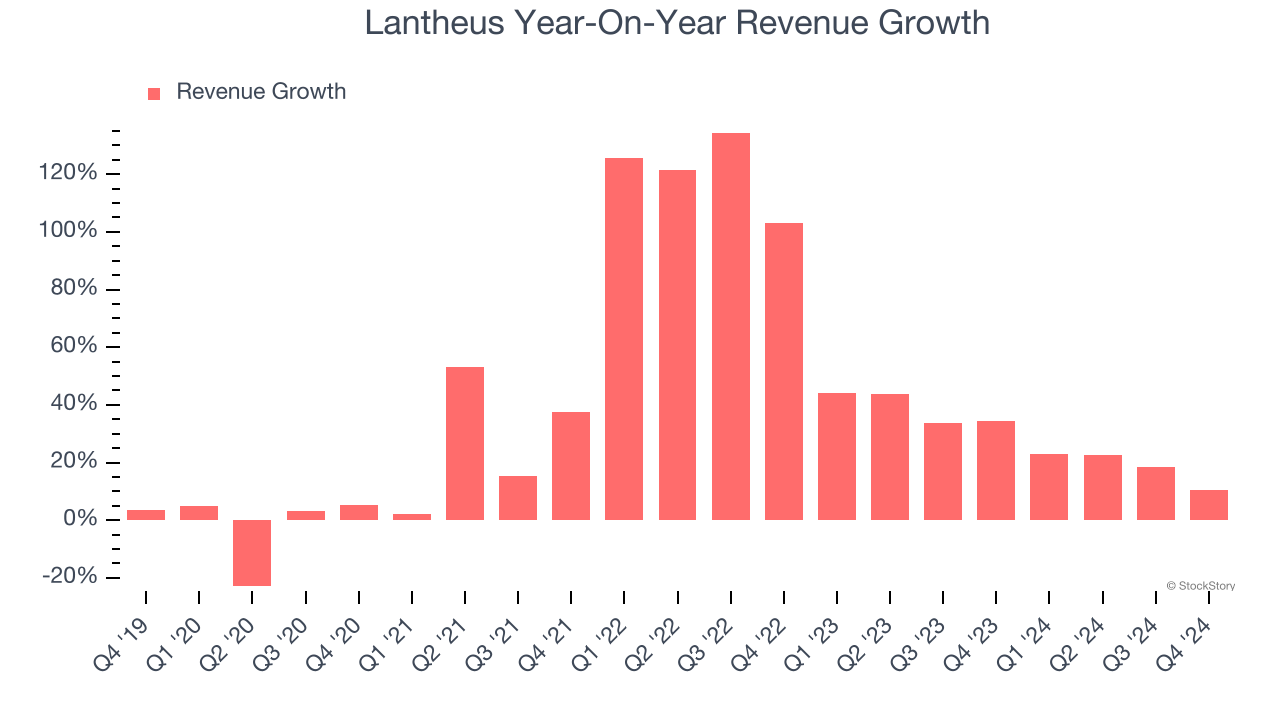
This quarter, Lantheus reported year-on-year revenue growth of 10.5%, and its $391.1 million of revenue exceeded Wall Street’s estimates by 3.7%.
Looking ahead, sell-side analysts expect revenue to grow 3.2% over the next 12 months, a deceleration versus the last two years. This projection doesn't excite us and suggests its products and services will see some demand headwinds. At least the company is tracking well in other measures of financial health.
Here at StockStory, we certainly understand the potential of thematic investing. Diverse winners from Microsoft (MSFT) to Alphabet (GOOG), Coca-Cola (KO) to Monster Beverage (MNST) could all have been identified as promising growth stories with a megatrend driving the growth. So, in that spirit, we’ve identified a relatively under-the-radar profitable growth stock benefiting from the rise of AI, available to you FREE via this link.
Operating Margin
Lantheus has managed its cost base well over the last five years. It demonstrated solid profitability for a healthcare business, producing an average operating margin of 17.5%.
Analyzing the trend in its profitability, Lantheus’s operating margin rose by 31 percentage points over the last five years, as its sales growth gave it immense operating leverage. Zooming in on its more recent performance, we can see the company’s trajectory is intact as its margin has also increased by 25.9 percentage points on a two-year basis. These data points are very encouraging and shows momentum is on its side.
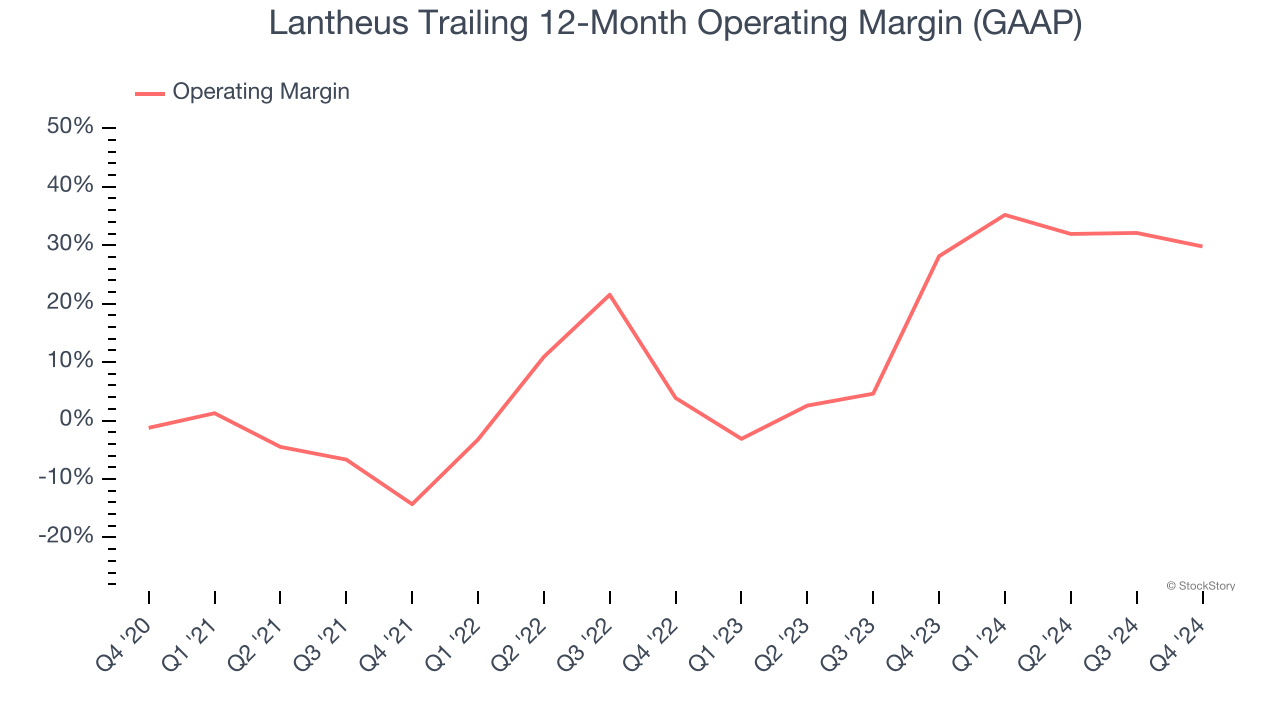
This quarter, Lantheus generated an operating profit margin of 29.1%, down 9.7 percentage points year on year. This contraction shows it was recently less efficient because its expenses grew faster than its revenue.
Earnings Per Share
We track the long-term change in earnings per share (EPS) for the same reason as long-term revenue growth. Compared to revenue, however, EPS highlights whether a company’s growth is profitable.
Lantheus’s EPS grew at an astounding 42.1% compounded annual growth rate over the last five years, higher than its 34.6% annualized revenue growth. This tells us the company became more profitable on a per-share basis as it expanded.
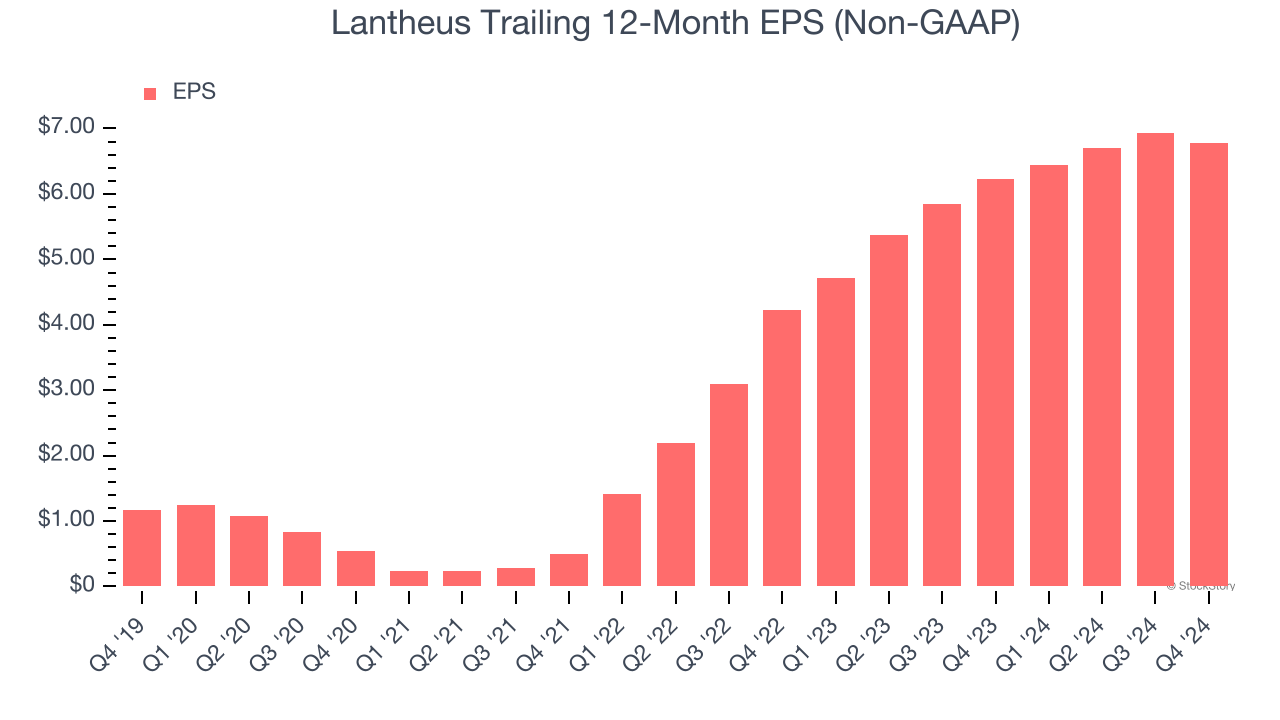
Diving into Lantheus’s quality of earnings can give us a better understanding of its performance. As we mentioned earlier, Lantheus’s operating margin declined this quarter but expanded by 31 percentage points over the last five years. This was the most relevant factor (aside from the revenue impact) behind its higher earnings; taxes and interest expenses can also affect EPS but don’t tell us as much about a company’s fundamentals.
In Q4, Lantheus reported EPS at $1.59, down from $1.75 in the same quarter last year. Despite falling year on year, this print beat analysts’ estimates by 3%. Over the next 12 months, Wall Street expects Lantheus’s full-year EPS of $6.78 to grow 1.8%.
Key Takeaways from Lantheus’s Q4 Results
We enjoyed seeing Lantheus beat analysts’ revenue and EPS expectations this quarter. We were also happy its full-year EPS guidance outperformed Wall Street’s estimates. On the other hand, its full-year revenue guidance missed. Zooming out, we think this was a decent quarter featuring some areas of strength but also some blemishes. The stock traded up 6.2% to $85.01 immediately after reporting.
Is Lantheus an attractive investment opportunity right now? We think that the latest quarter is only one piece of the longer-term business quality puzzle. Quality, when combined with valuation, can help determine if the stock is a buy. We cover that in our actionable full research report which you can read here, it’s free.