
Calavo currently trades at $22.51 per share and has shown little upside over the past six months, posting a small loss of 3.8%. The stock also fell short of the S&P 500’s 5.1% gain during that period.
Is there a buying opportunity in Calavo, or does it present a risk to your portfolio? Dive into our full research report to see our analyst team’s opinion, it’s free.
We don't have much confidence in Calavo. Here are three reasons why we avoid CVGW and a stock we'd rather own.
Why Do We Think Calavo Will Underperform?
A trailblazer in the avocado industry, Calavo Growers (NASDAQ: CVGW) is a pioneering California-based provider of high-quality avocados and other fresh food products.
1. Revenue Spiraling Downwards
A company’s long-term sales performance is one signal of its overall quality. Even a bad business can shine for one or two quarters, but a top-tier one grows for years. Calavo struggled to consistently generate demand over the last three years as its sales dropped at a 14.4% annual rate. This wasn’t a great result and is a sign of poor business quality. 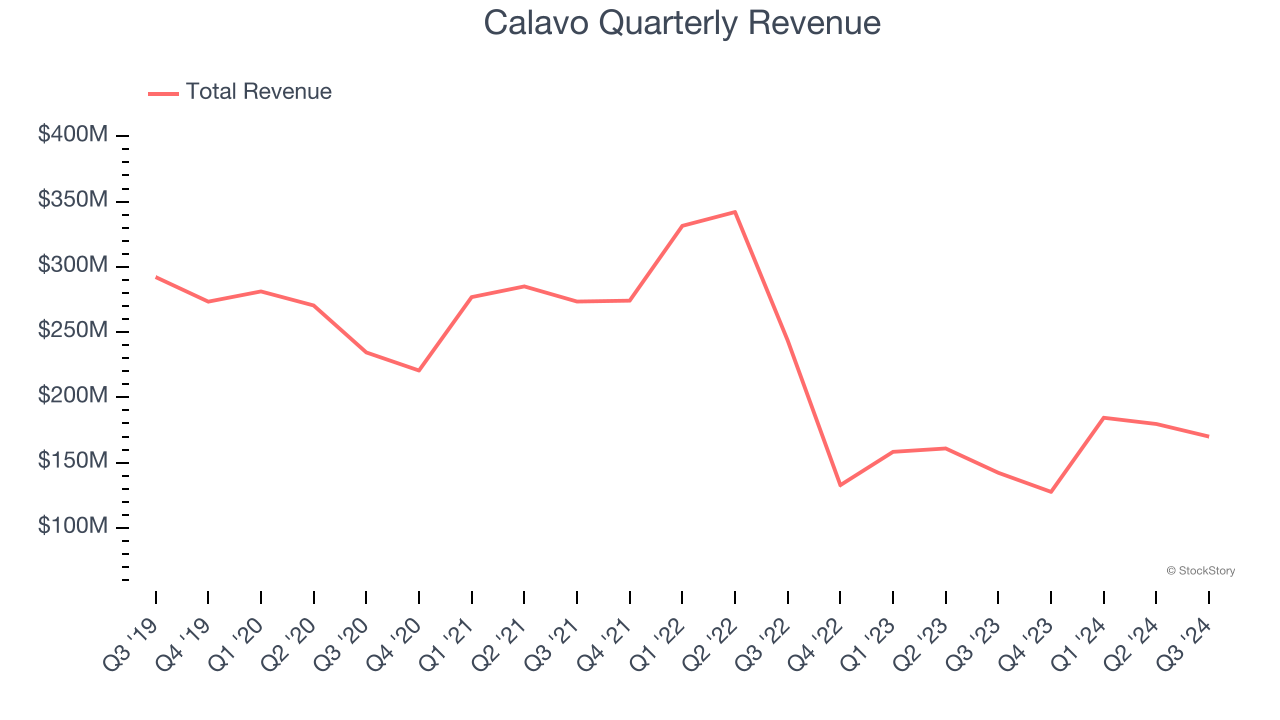
2. Fewer Distribution Channels Limit its Ceiling
With $661.5 million in revenue over the past 12 months, Calavo is a small consumer staples company, which sometimes brings disadvantages compared to larger competitors benefiting from economies of scale and negotiating leverage with retailers.
3. Low Gross Margin Reveals Weak Structural Profitability
All else equal, we prefer higher gross margins because they usually indicate that a company sells more differentiated products, has a stronger brand, and commands pricing power.
Calavo has bad unit economics for a consumer staples company, signaling it operates in a competitive market and lacks pricing power because its products can be substituted. As you can see below, it averaged a 10.7% gross margin over the last two years. That means Calavo paid its suppliers a lot of money ($89.31 for every $100 in revenue) to run its business. 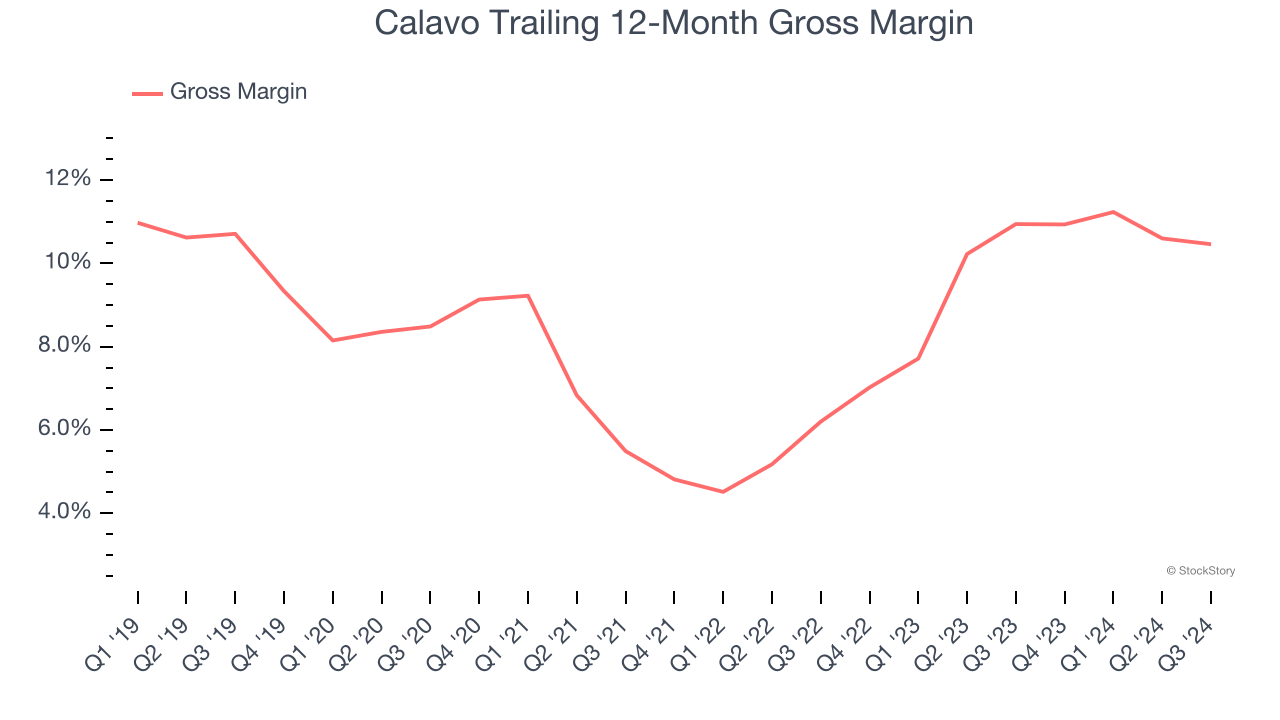
Final Judgment
We see the value of companies helping consumers, but in the case of Calavo, we’re out. With its shares trailing the market in recent months, the stock trades at 13× forward price-to-earnings (or $22.51 per share). This valuation is reasonable, but the company’s shaky fundamentals present too much downside risk. There are better stocks to buy right now. We’d suggest looking at a fast-growing restaurant franchise with an A+ ranch dressing sauce.
Stocks We Would Buy Instead of Calavo
The elections are now behind us. With rates dropping and inflation cooling, many analysts expect a breakout market - and we’re zeroing in on the stocks that could benefit immensely.
Take advantage of the rebound by checking out our Top 9 Market-Beating Stocks. This is a curated list of our High Quality stocks that have generated a market-beating return of 175% over the last five years.
Stocks that made our list in 2019 include now familiar names such as Nvidia (+2,183% between December 2019 and December 2024) as well as under-the-radar businesses like Comfort Systems (+751% five-year return). Find your next big winner with StockStory today for free.


