
Since September 2024, PTC has been in a holding pattern, posting a small loss of 4.7% while floating around $160.81. The stock also fell short of the S&P 500’s 1.5% gain during that period.
Is now the time to buy PTC? Find out in our full research report, it’s free.
Why Does PTC Stock Spark Debate?
Used to design the Airbus A380 and Boeing 787 Dreamliner commercial airplanes, PTC’s (NASDAQ: PTC) software-as-service platform helps engineers and designers create and test products before manufacturing.
Two Things to Like:
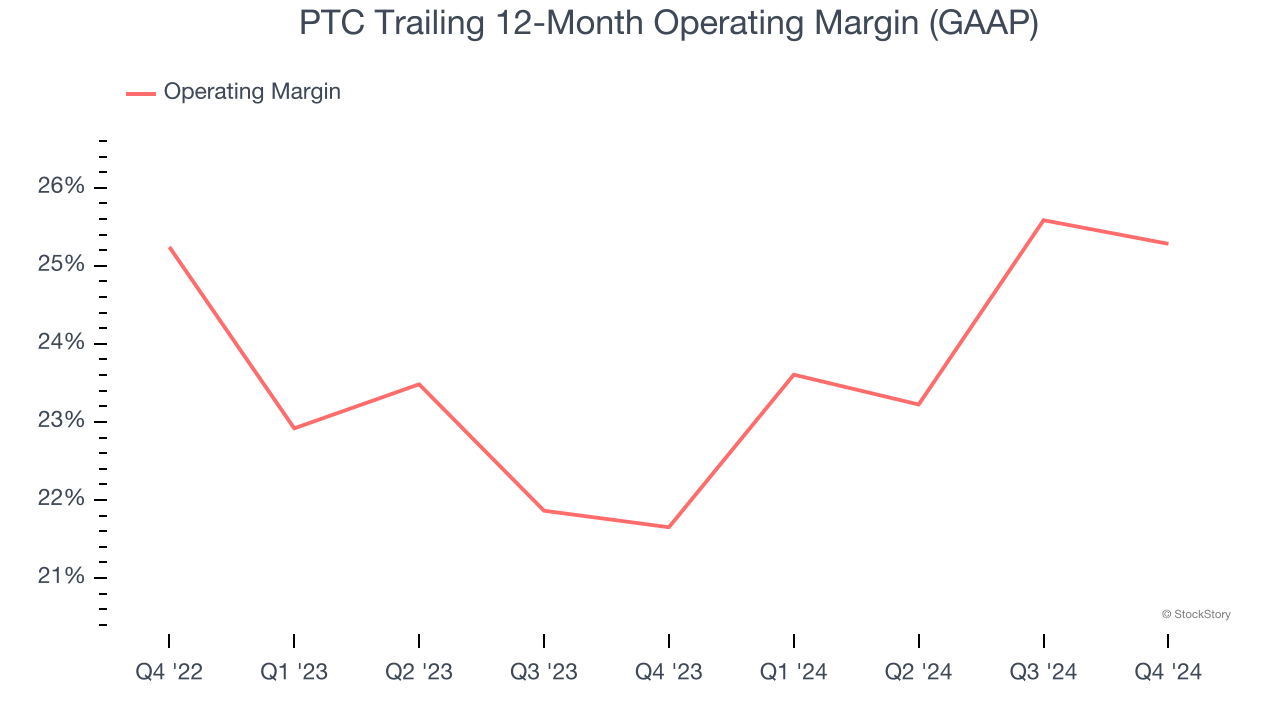
1. Operating Margin Reveals a Well-Run Organization
While many software businesses point investors to their adjusted profits, which exclude stock-based compensation (SBC), we prefer GAAP operating margin because SBC is a legitimate expense used to attract and retain talent. This is one of the best measures of profitability because it shows how much money a company takes home after developing, marketing, and selling its products.
PTC has been a well-oiled machine over the last year. It demonstrated elite profitability for a software business, boasting an average operating margin of 25.3%. This result isn’t surprising as its high gross margin gives it a favorable starting point.
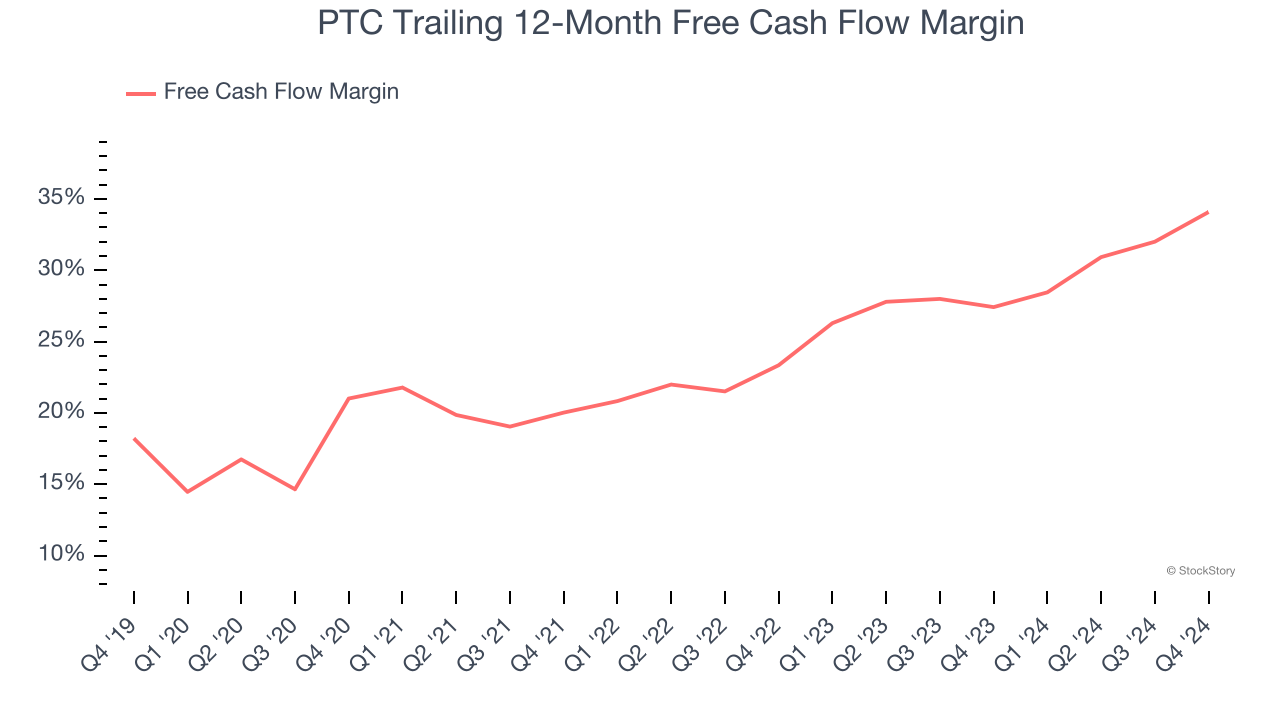
2. Excellent Free Cash Flow Margin Boosts Reinvestment Potential
If you’ve followed StockStory for a while, you know we emphasize free cash flow. Why, you ask? We believe that in the end, cash is king, and you can’t use accounting profits to pay the bills.
PTC has shown terrific cash profitability, driven by its lucrative business model that enables it to reinvest, return capital to investors, and stay ahead of the competition while maintaining an ample cushion. The company’s free cash flow margin was among the best in the software sector, averaging an eye-popping 34.1% over the last year.
One Reason to be Careful:
Weak Billings Point to Soft Demand
Billings is a non-GAAP metric that is often called “cash revenue” because it shows how much money the company has collected from customers in a certain period. This is different from revenue, which must be recognized in pieces over the length of a contract.
PTC’s billings came in at $537.3 million in Q4, and over the last four quarters, its year-on-year growth averaged 7%. This performance was underwhelming and suggests that increasing competition is causing challenges in acquiring/retaining customers. 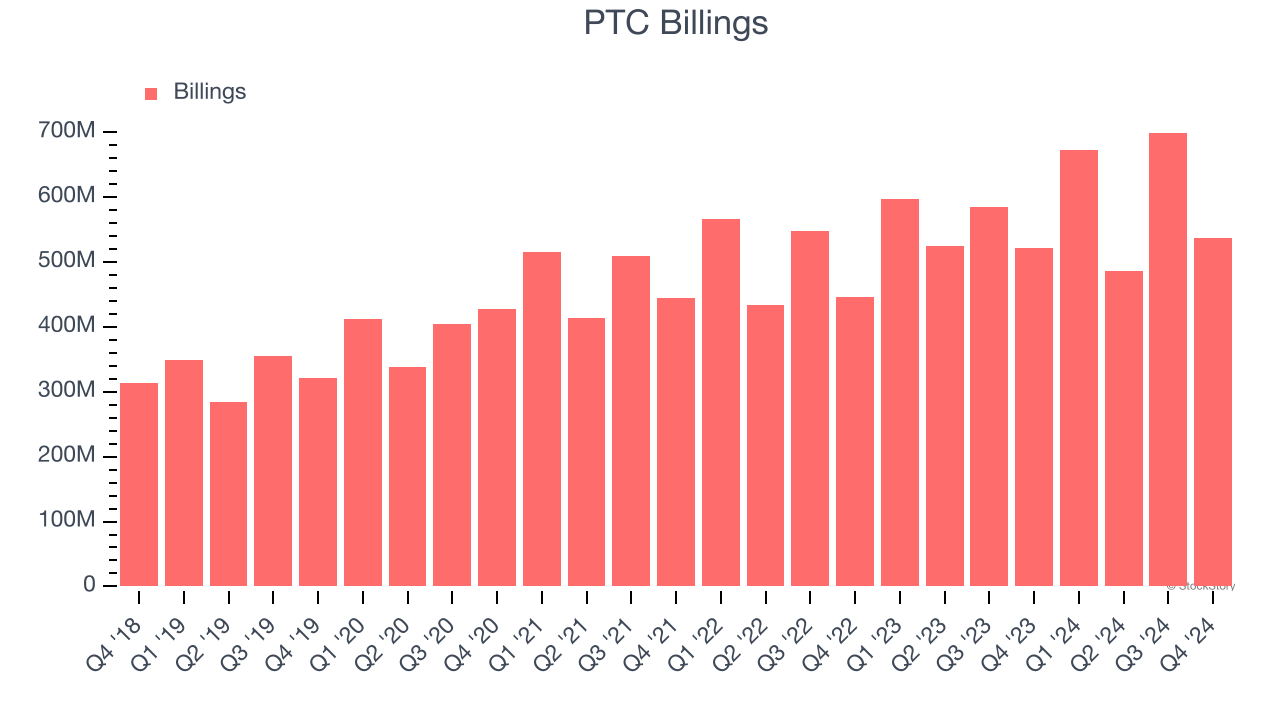
Final Judgment
PTC’s positive characteristics outweigh the negatives. With its shares lagging the market recently, the stock trades at 7.6× forward price-to-sales (or $160.81 per share). Is now the right time to buy? See for yourself in our comprehensive research report, it’s free.
Stocks We Like Even More Than PTC
With rates dropping, inflation stabilizing, and the elections in the rearview mirror, all signs point to the start of a new bull run - and we’re laser-focused on finding the best stocks for this upcoming cycle.
Put yourself in the driver’s seat by checking out our Top 5 Growth Stocks for this month. This is a curated list of our High Quality stocks that have generated a market-beating return of 175% over the last five years.
Stocks that made our list in 2019 include now familiar names such as Nvidia (+2,183% between December 2019 and December 2024) as well as under-the-radar businesses like Comfort Systems (+751% five-year return). Find your next big winner with StockStory today for free.


