Looking back on defense contractors stocks’ Q4 earnings, we examine this quarter’s best and worst performers, including Huntington Ingalls (NYSE: HII) and its peers.
Defense contractors typically require technical expertise and government clearance. Companies in this sector can also enjoy long-term contracts with government bodies, leading to more predictable revenues. Combined, these factors create high barriers to entry and can lead to limited competition. Lately, geopolitical tensions–whether it be Russia’s invasion of Ukraine or China’s aggression towards Taiwan–highlight the need for defense spending. On the other hand, demand for these products can ebb and flow with defense budgets and even who is president, as different administrations can have vastly different ideas of how to allocate federal funds.
The 14 defense contractors stocks we track reported a mixed Q4. As a group, revenues beat analysts’ consensus estimates by 2.6% while next quarter’s revenue guidance was 4% above.
While some defense contractors stocks have fared somewhat better than others, they have collectively declined. On average, share prices are down 2% since the latest earnings results.
Huntington Ingalls (NYSE: HII)
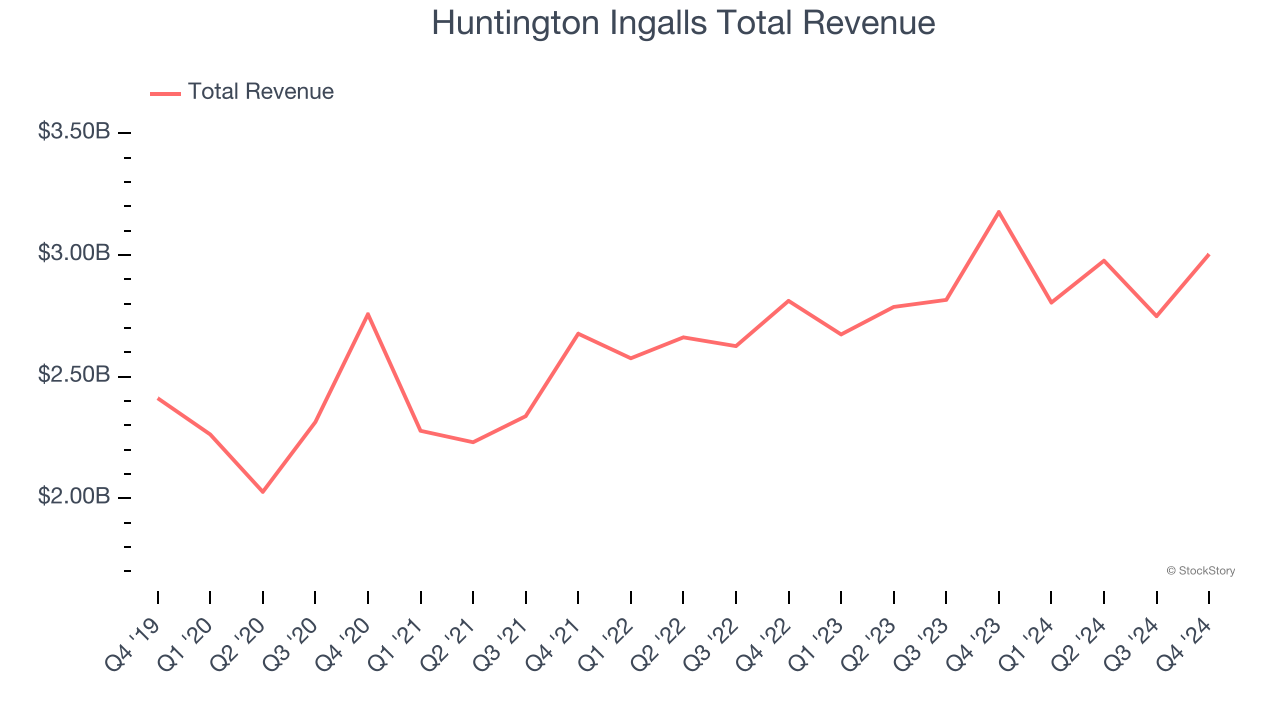
Building Nimitz-class aircraft carriers used in active service, Huntington Ingalls (NYSE: HII) develops marine vessels and their mission systems and maintenance services.
Huntington Ingalls reported revenues of $3.00 billion, down 5.4% year on year. This print fell short of analysts’ expectations by 1.8%. Overall, it was a disappointing quarter for the company with a significant miss of analysts’ adjusted operating income estimates.
Chris Kastner, HII’s president and CEO, said, “We continue to make progress on ships put under contract pre-COVID, and are working diligently with our customers to put over $50 billion of new work under contract. Mission Technologies continued its strong track record of top line growth and margin expansion and secured an impressive $12 billion in total future contract value during 2024. We enter 2025 focused on our mission to deliver the world’s most powerful ships and all-domain solutions in service of the nation.”
The market was likely pricing in the results, and the stock is flat since reporting. It currently trades at $195.46.
Read our full report on Huntington Ingalls here, it’s free.
Best Q4: Mercury Systems (NASDAQ: MRCY)
Founded in 1981, Mercury Systems (NASDAQ: MRCY) specializes in providing processing subsystems and components for primarily defense applications.
Mercury Systems reported revenues of $223.1 million, up 13% year on year, outperforming analysts’ expectations by 23.9%. The business had an incredible quarter with an impressive beat of analysts’ organic revenue estimates and a solid beat of analysts’ EPS estimates.
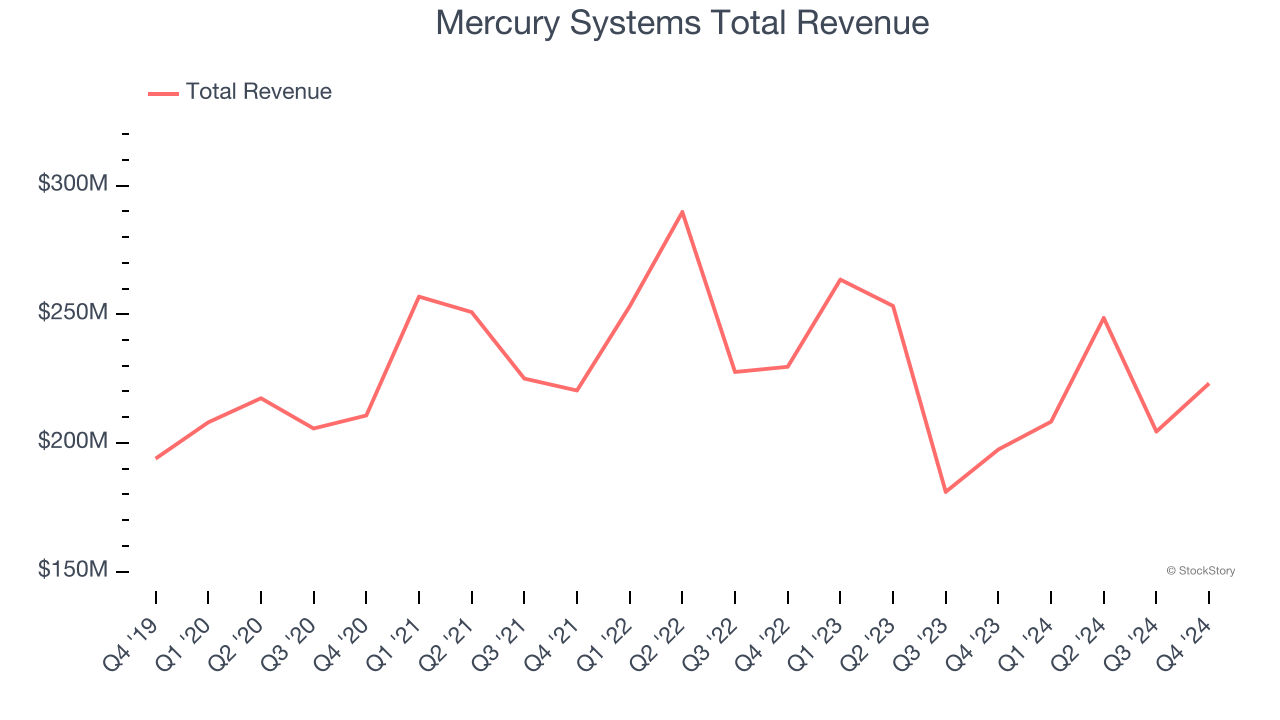
Mercury Systems scored the biggest analyst estimates beat among its peers. The market seems content with the results as the stock is up 2.9% since reporting. It currently trades at $43.29.
Is now the time to buy Mercury Systems? Access our full analysis of the earnings results here, it’s free.
Weakest Q4: AeroVironment (NASDAQ: AVAV)
Focused on the future of autonomous military combat, AeroVironment (NASDAQ: AVAV) specializes in advanced unmanned aircraft systems and electric vehicle charging solutions.
AeroVironment reported revenues of $167.6 million, down 10.2% year on year, falling short of analysts’ expectations by 10.9%. It was a disappointing quarter as it posted full-year revenue guidance missing analysts’ expectations.
AeroVironment delivered the weakest performance against analyst estimates, slowest revenue growth, and weakest full-year guidance update in the group. As expected, the stock is down 13.1% since the results and currently trades at $123.55.
Read our full analysis of AeroVironment’s results here.
CACI (NYSE: CACI)
Founded to commercialize SIMSCRIPT, CACI International (NYSE: CACI) offers defense, intelligence, and IT solutions to support national security and government transformation efforts.
CACI reported revenues of $2.1 billion, up 14.5% year on year. This result topped analysts’ expectations by 3.4%. Overall, it was an exceptional quarter as it also put up a solid beat of analysts’ backlog and EBITDA estimates.
The stock is down 18.1% since reporting and currently trades at $380.79.
Read our full, actionable report on CACI here, it’s free.
Leonardo DRS (NASDAQ: DRS)
Developing submarine detection systems for the U.S. Navy, Leonardo DRS (NASDAQ: DRS) is a provider of defense systems, electronics, and military support services.
Leonardo DRS reported revenues of $981 million, up 5.9% year on year. This print beat analysts’ expectations by 4.9%. It was a very strong quarter as it also logged an impressive beat of analysts’ adjusted operating income estimates and full-year revenue guidance beating analysts’ expectations.
The stock is up 4.9% since reporting and currently trades at $30.97.
Read our full, actionable report on Leonardo DRS here, it’s free.
Want to invest in winners with rock-solid fundamentals? Check out our Top 5 Growth Stocks and add them to your watchlist. These companies are poised for growth regardless of the political or macroeconomic climate.
Join Paid Stock Investor Research
Help us make StockStory more helpful to investors like yourself. Join our paid user research session and receive a $50 Amazon gift card for your opinions. Sign up here.