
Personalized clothing company Stitch Fix (NASDAQ: SFIX) announced better-than-expected revenue in Q4 CY2024, but sales fell by 5.5% year on year to $312.1 million. On top of that, next quarter’s revenue guidance ($313.5 million at the midpoint) was surprisingly good and 12.5% above what analysts were expecting. Its GAAP loss of $0.05 per share was 55.4% above analysts’ consensus estimates.
Is now the time to buy Stitch Fix? Find out by accessing our full research report, it’s free.
Stitch Fix (SFIX) Q4 CY2024 Highlights:
- Revenue: $312.1 million vs analyst estimates of $298.9 million (5.5% year-on-year decline, 4.4% beat)
- EPS (GAAP): -$0.05 vs analyst estimates of -$0.11 (55.4% beat)
- Adjusted EBITDA: $15.92 million vs analyst estimates of $9.67 million (5.1% margin, 64.7% beat)
- The company lifted its revenue guidance for the full year to $1.23 billion at the midpoint from $1.16 billion, a 6.3% increase
- EBITDA guidance for the full year is $43.5 million at the midpoint, above analyst estimates of $31.23 million
- Operating Margin: -2.9%, up from -11.5% in the same quarter last year
- Free Cash Flow was -$19.44 million compared to -$26.07 million in the same quarter last year
- Active Clients: 2.37 million, down 434,000 year on year
- Market Capitalization: $525.1 million
Company Overview
One of the original subscription box companies, Stitch Fix (NASDAQ: SFIX) is an online personal styling and fashion service that curates personalized clothing selections for customers.
Apparel and Accessories
Thanks to social media and the internet, not only are styles changing more frequently today than in decades past but also consumers are shifting the way they buy their goods, favoring omnichannel and e-commerce experiences. Some apparel and accessories companies have made concerted efforts to adapt while those who are slower to move may fall behind.
Sales Growth
Reviewing a company’s long-term sales performance reveals insights into its quality. Any business can have short-term success, but a top-tier one grows for years. Stitch Fix’s demand was weak over the last five years as its sales fell at a 6% annual rate. This was below our standards and is a sign of poor business quality.
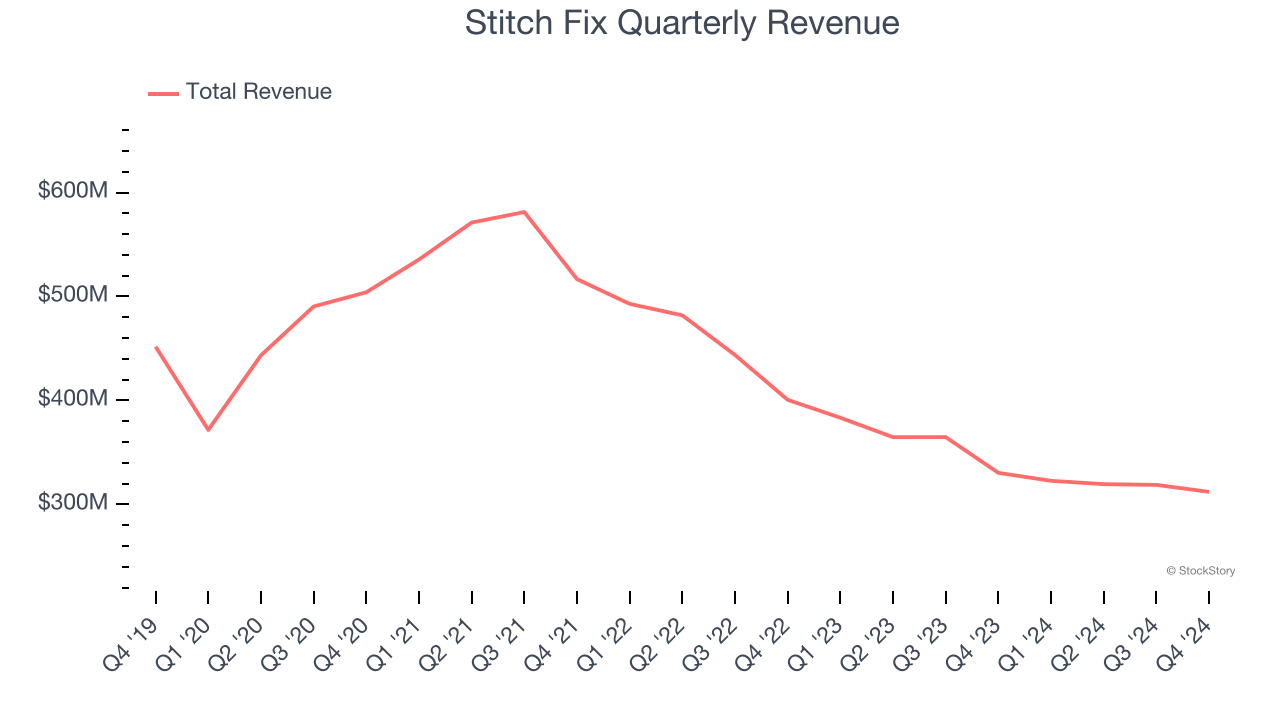
Long-term growth is the most important, but within consumer discretionary, product cycles are short and revenue can be hit-driven due to rapidly changing trends and consumer preferences. Stitch Fix’s recent history shows its demand remained suppressed as its revenue has declined by 16.3% annually over the last two years. 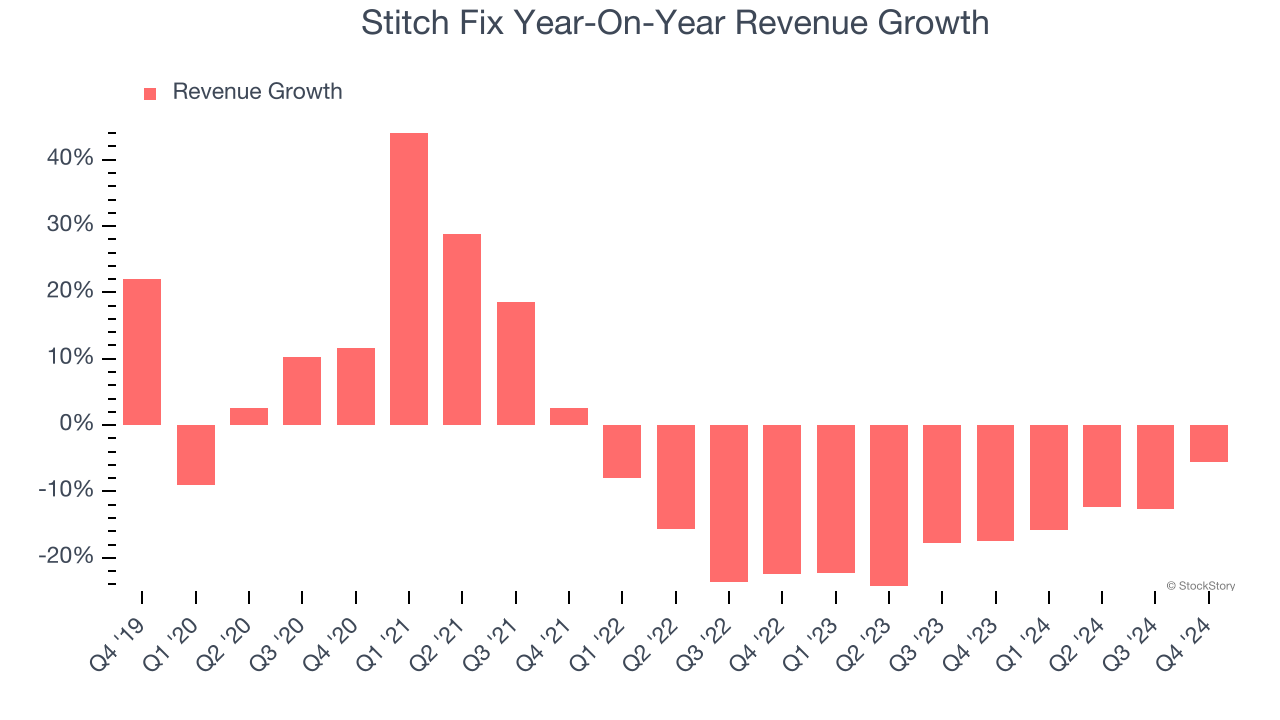
We can dig further into the company’s revenue dynamics by analyzing its number of active clients, which reached 2.37 million in the latest quarter. Over the last two years, Stitch Fix’s active clients averaged 17.4% year-on-year declines. Because this number aligns with its revenue growth during the same period, we can see the company’s monetization was fairly consistent. 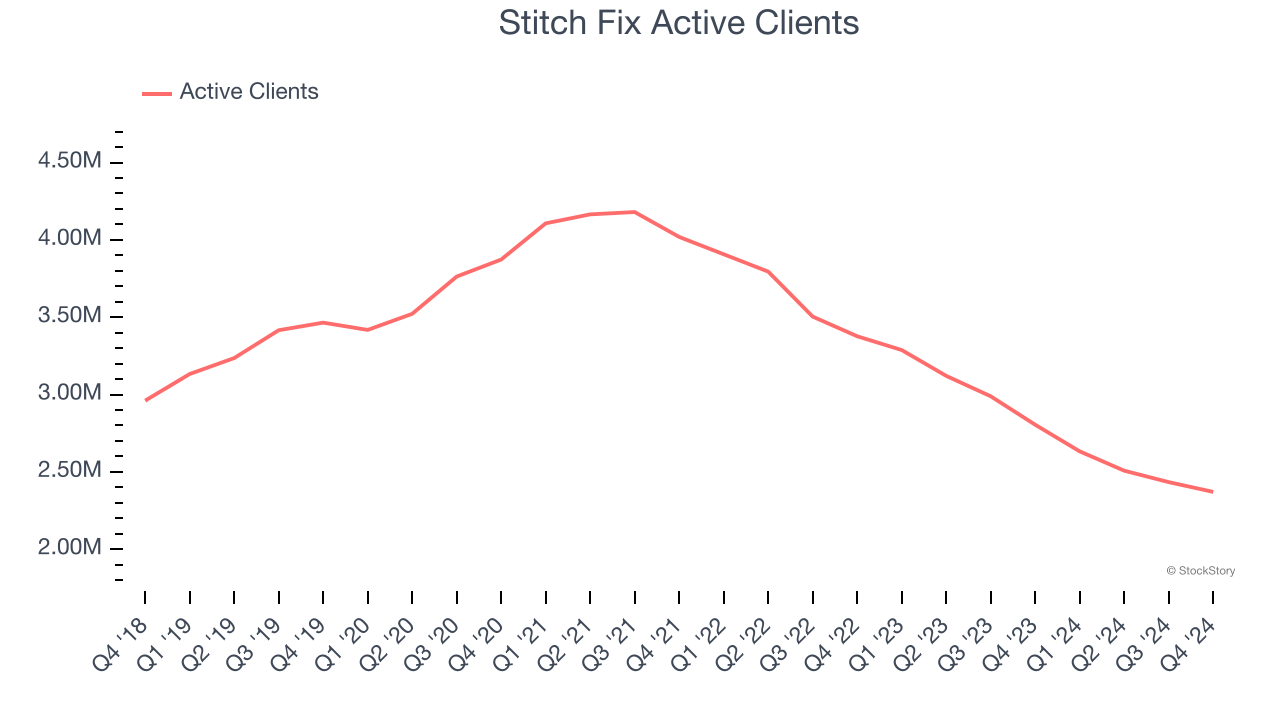
This quarter, Stitch Fix’s revenue fell by 5.5% year on year to $312.1 million but beat Wall Street’s estimates by 4.4%. Company management is currently guiding for a 2.9% year-on-year decline in sales next quarter.
Looking further ahead, sell-side analysts expect revenue to decline by 5.7% over the next 12 months. Although this projection is better than its two-year trend, it's hard to get excited about a company that is struggling with demand.
Software is eating the world and there is virtually no industry left that has been untouched by it. That drives increasing demand for tools helping software developers do their jobs, whether it be monitoring critical cloud infrastructure, integrating audio and video functionality, or ensuring smooth content streaming. Click here to access a free report on our 3 favorite stocks to play this generational megatrend.
Operating Margin
Stitch Fix’s operating margin might fluctuated slightly over the last 12 months but has remained more or less the same, averaging negative 7.2% over the last two years. Unprofitable consumer discretionary companies that fail to improve their losses or grow sales rapidly deserve extra scrutiny. For the time being, it’s unclear if Stitch Fix’s business model is sustainable.
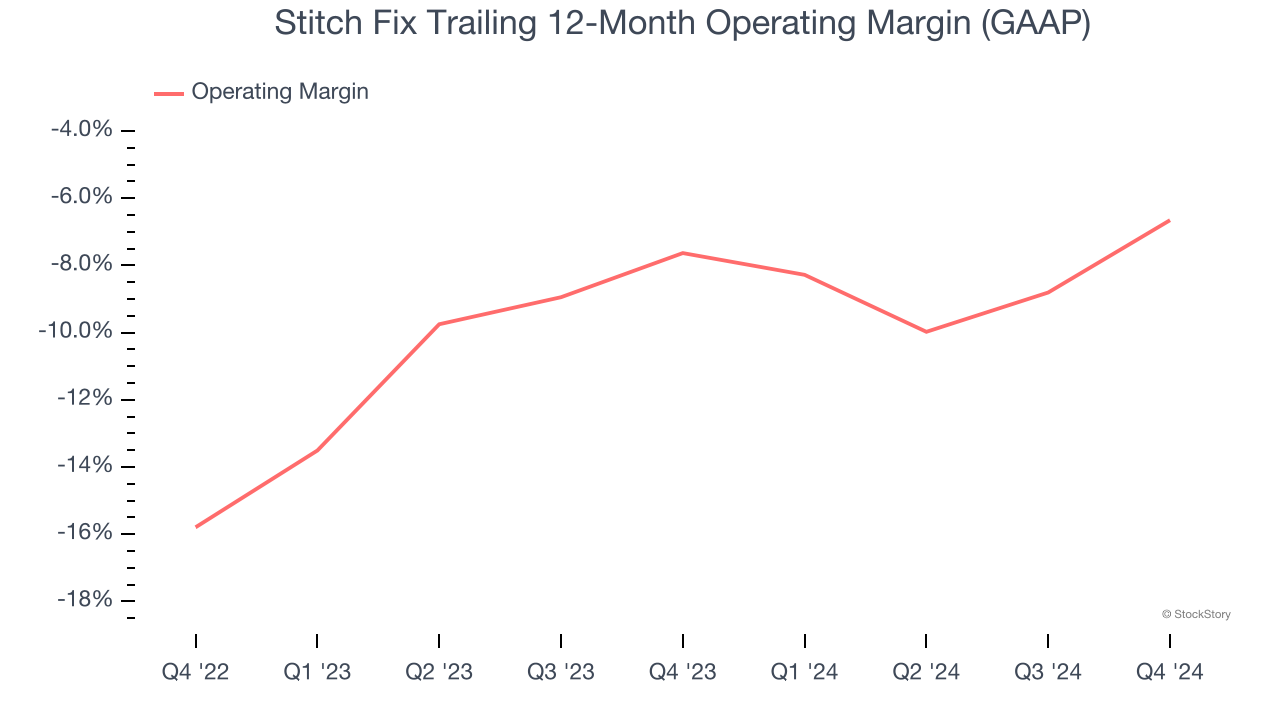
In Q4, Stitch Fix generated a negative 2.9% operating margin. The company's consistent lack of profits raise a flag.
Earnings Per Share
Revenue trends explain a company’s historical growth, but the long-term change in earnings per share (EPS) points to the profitability of that growth – for example, a company could inflate its sales through excessive spending on advertising and promotions.
Sadly for Stitch Fix, its EPS declined by 34.1% annually over the last five years, more than its revenue. This tells us the company struggled because its fixed cost base made it difficult to adjust to shrinking demand.
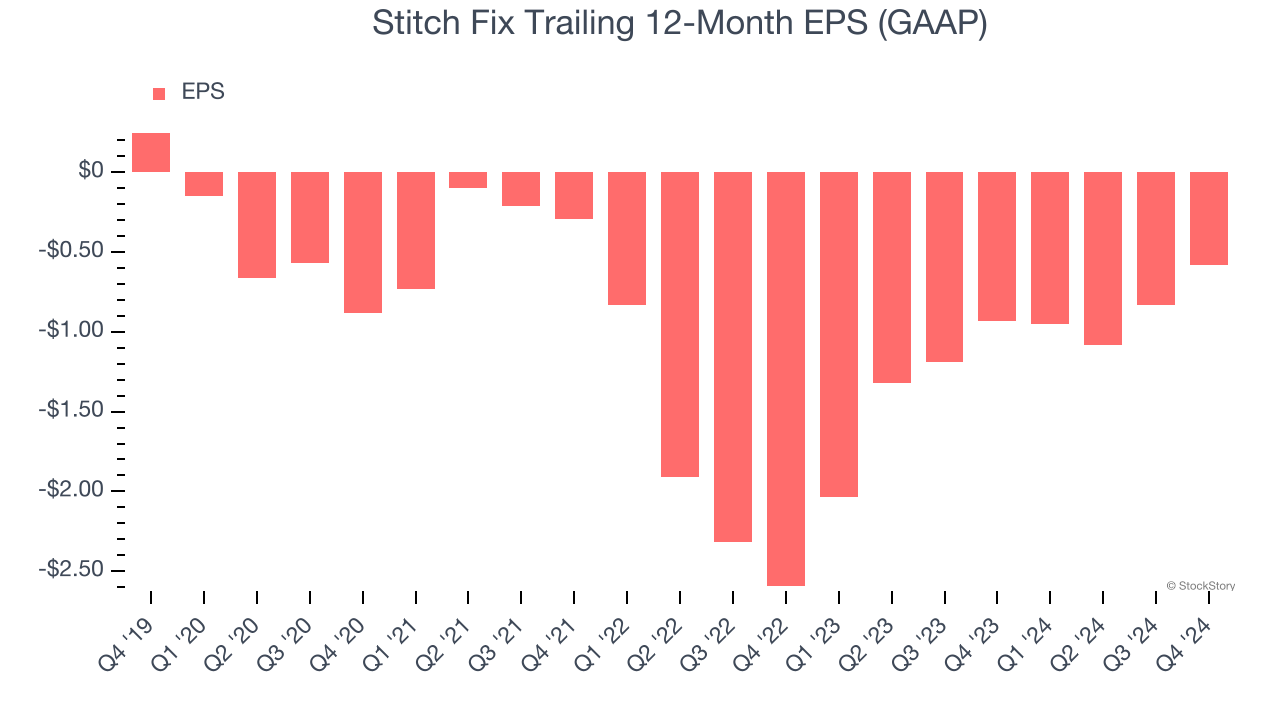
In Q4, Stitch Fix reported EPS at negative $0.05, up from negative $0.30 in the same quarter last year. This print easily cleared analysts’ estimates, and shareholders should be content with the results. Over the next 12 months, Wall Street is optimistic. Analysts forecast Stitch Fix’s full-year EPS of negative $0.58 will reach break even.
Key Takeaways from Stitch Fix’s Q4 Results
It was great to see Stitch Fix upgrade its full-year revenue and EBITDA guidance this quarter. We were also excited its revenue, EPS, and EBITDA outperformed Wall Street’s estimates by a wide margin. Zooming out, we think this "beat-and-raise" quarter featured some important positives. The stock traded up 18.2% to $4.99 immediately after reporting.
Indeed, Stitch Fix had a rock-solid quarterly earnings result, but is this stock a good investment here? We think that the latest quarter is only one piece of the longer-term business quality puzzle. Quality, when combined with valuation, can help determine if the stock is a buy. We cover that in our actionable full research report which you can read here, it’s free.


