
Healthcare technology company Phreesia (NYSE: PHR) beat Wall Street’s revenue expectations in Q4 CY2024, with sales up 15.4% year on year to $109.7 million. The company expects the full year’s revenue to be around $477 million, close to analysts’ estimates. Its GAAP loss of $0.11 per share was 35% above analysts’ consensus estimates.
Is now the time to buy Phreesia? Find out by accessing our full research report, it’s free.
Phreesia (PHR) Q4 CY2024 Highlights:
- Revenue: $109.7 million vs analyst estimates of $109 million (15.4% year-on-year growth, 0.7% beat)
- EPS (GAAP): -$0.11 vs analyst estimates of -$0.17 (35% beat)
- Adjusted EBITDA: $16.37 million vs analyst estimates of $14.16 million (14.9% margin, 15.6% beat)
- Management’s revenue guidance for the upcoming financial year 2026 is $477 million at the midpoint, in line with analyst expectations and implying 13.6% growth (vs 17.9% in FY2025)
- EBITDA guidance for the upcoming financial year 2026 is $83 million at the midpoint, above analyst estimates of $81.21 million
- Operating Margin: -6.9%, up from -31.1% in the same quarter last year
- Free Cash Flow was $9.20 million, up from -$10.94 million in the same quarter last year
- Customers: 4,341, up from 4,237 in the previous quarter
- Market Capitalization: $1.35 billion
"We are pleased with our solid finish to fiscal 2025 and I am excited about the new products we have introduced over the past several quarters that improve medication adherence and the overall patient and provider experience," said CEO and Co-Founder Chaim Indig.
Company Overview
Founded in 2005, Phreesia (NYSE: PHR) is a healthcare technology company that offers a cloud-based platform for patient intake management, enabling providers to streamline administrative tasks.
Healthcare Technology for Providers
The healthcare technology industry focuses on delivering software, data analytics, and workflow solutions to hospitals, clinics, and other care facilities. These companies enable providers to streamline operations, optimize patient outcomes, and transition to value-based care models. They boast subscription-based revenues or long-term contracts, providing financial stability and growth potential. However, they face challenges such as lengthy sales cycles, significant upfront investment in technology development, and reliance on providers’ adoption of new tools, which can be hindered by budget constraints or resistance to change. Over the next few years, the sector is poised for growth as providers increasingly prioritize digital transformation and efficiency in response to rising healthcare costs and patient demand for seamless care. Tailwinds include the growing adoption of AI-driven tools for patient engagement and operational improvements, government incentives for digitization, and the expansion of telehealth and remote patient monitoring. However, headwinds such as tightening hospital budgets, cybersecurity threats, and the fragmented nature of healthcare systems could slow adoption.
Sales Growth
A company’s long-term sales performance is one signal of its overall quality. Any business can experience short-term success, but top-performing ones enjoy sustained growth for years. Thankfully, Phreesia’s 27.5% annualized revenue growth over the last five years was exceptional. Its growth beat the average healthcare company and shows its offerings resonate with customers, a helpful starting point for our analysis.
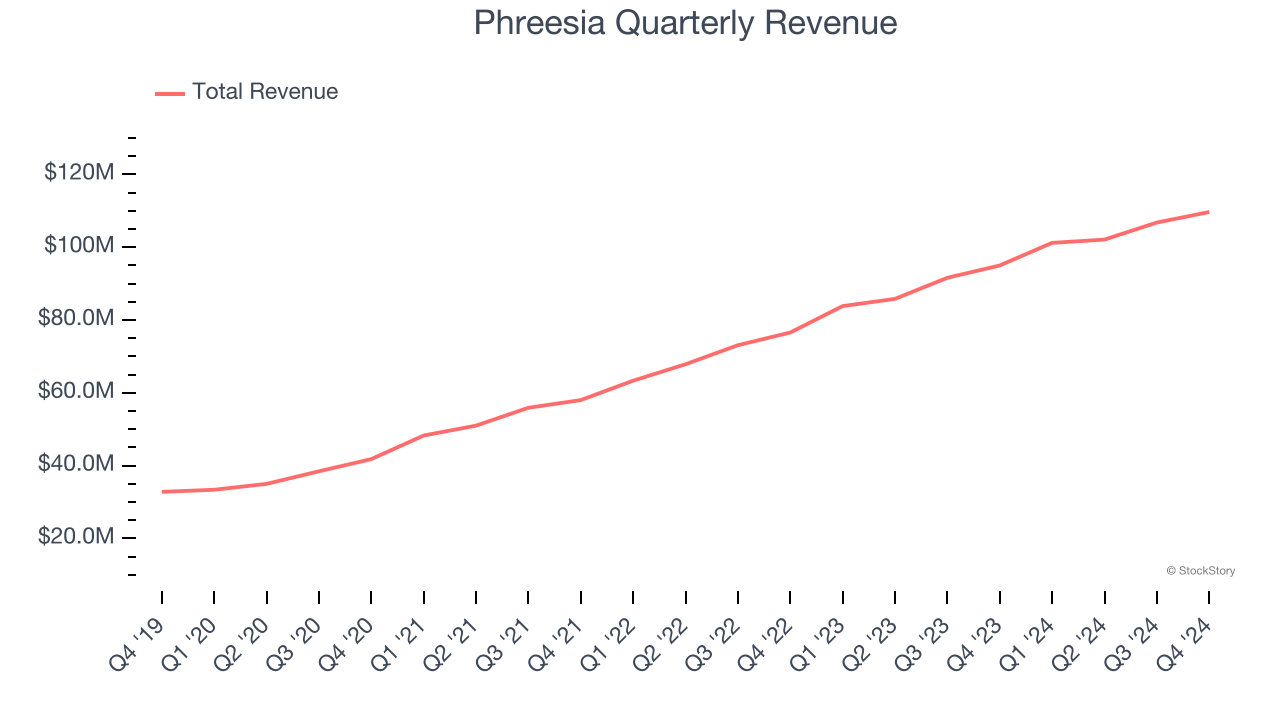
We at StockStory place the most emphasis on long-term growth, but within healthcare, a half-decade historical view may miss recent innovations or disruptive industry trends. Phreesia’s annualized revenue growth of 22.2% over the last two years is below its five-year trend, but we still think the results were good and suggest demand was healthy. 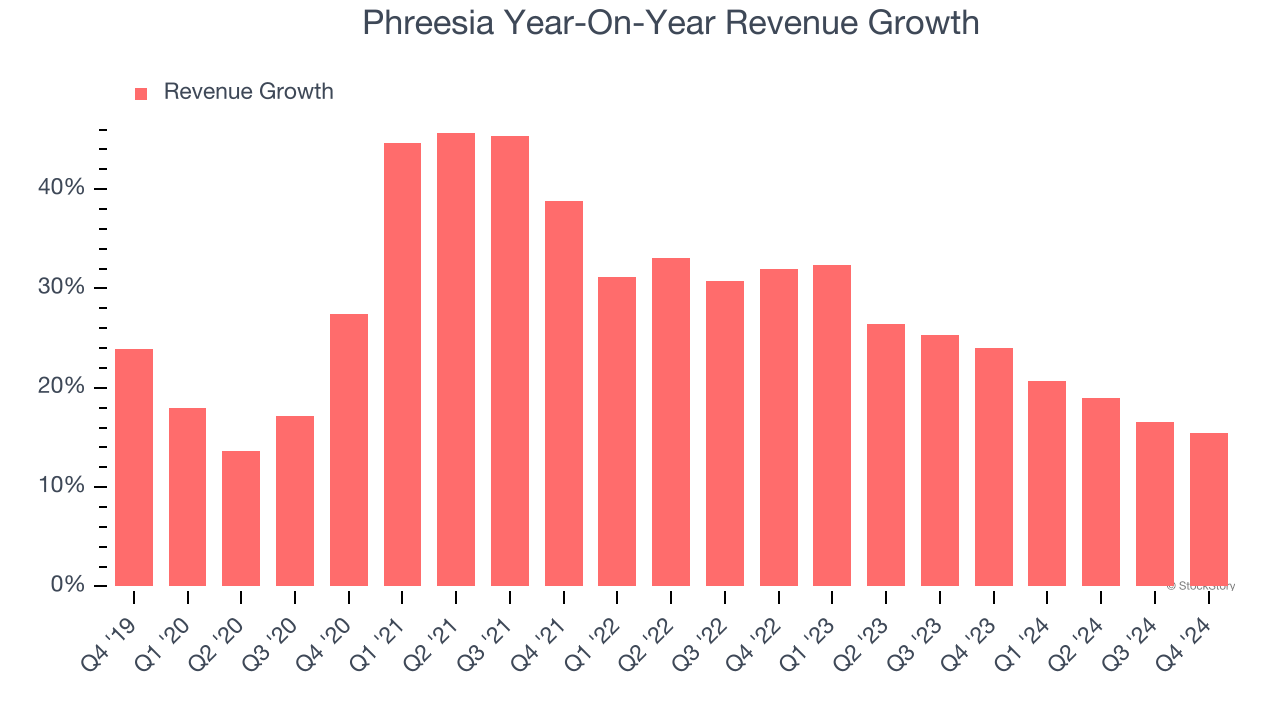
We can better understand the company’s revenue dynamics by analyzing its number of customers, which reached 4,341 in the latest quarter. Over the last two years, Phreesia’s customer base averaged 21.7% year-on-year growth. Because this number is in line with its revenue growth, we can see the average customer spent roughly the same amount each year on the company’s products and services. 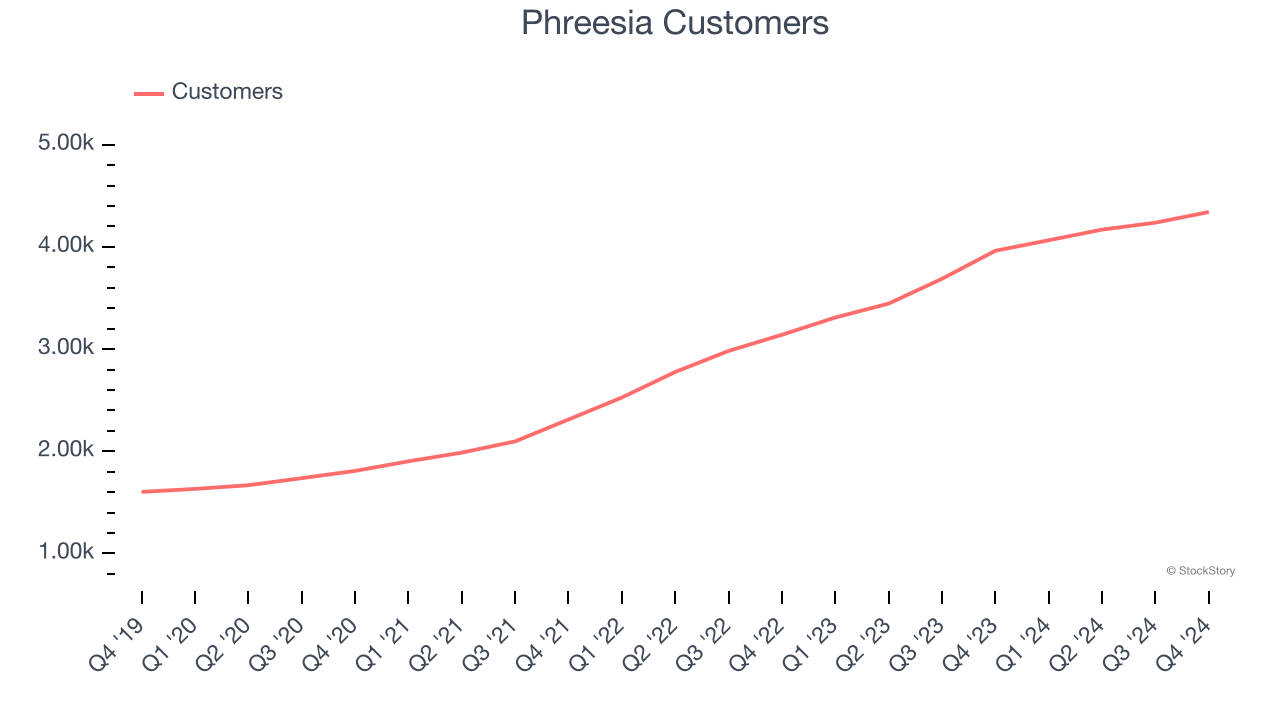
This quarter, Phreesia reported year-on-year revenue growth of 15.4%, and its $109.7 million of revenue exceeded Wall Street’s estimates by 0.7%.
Looking ahead, sell-side analysts expect revenue to grow 13.5% over the next 12 months, a deceleration versus the last two years. Still, this projection is healthy and implies the market is forecasting success for its products and services.
Here at StockStory, we certainly understand the potential of thematic investing. Diverse winners from Microsoft (MSFT) to Alphabet (GOOG), Coca-Cola (KO) to Monster Beverage (MNST) could all have been identified as promising growth stories with a megatrend driving the growth. So, in that spirit, we’ve identified a relatively under-the-radar profitable growth stock benefiting from the rise of AI, available to you FREE via this link.
Operating Margin
Phreesia’s high expenses have contributed to an average operating margin of negative 36.2% over the last five years. Unprofitable healthcare companies require extra attention because they could get caught swimming naked when the tide goes out.
On the plus side, Phreesia’s operating margin rose by 3.4 percentage points over the last five years, as its sales growth gave it operating leverage. This performance was mostly driven by its recent improvements as the company’s margin has increased by 49 percentage points on a two-year basis.
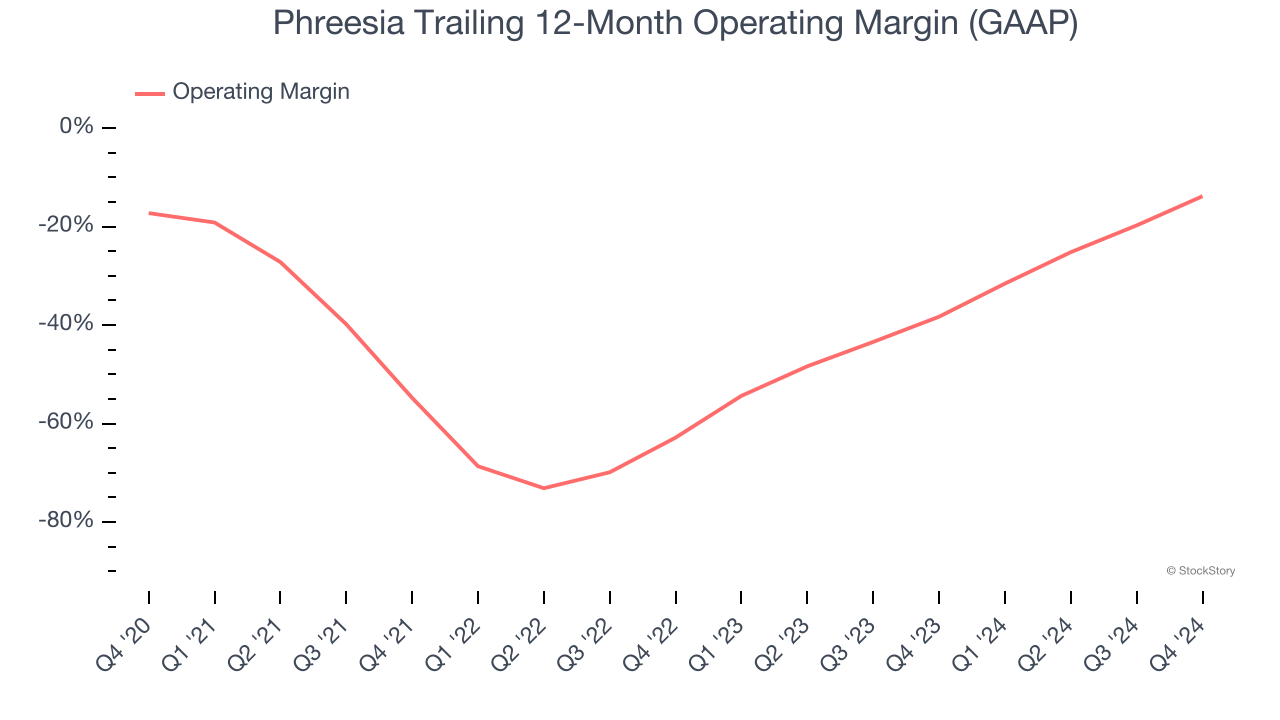
This quarter, Phreesia generated a negative 6.9% operating margin.
Earnings Per Share
We track the long-term change in earnings per share (EPS) for the same reason as long-term revenue growth. Compared to revenue, however, EPS highlights whether a company’s growth is profitable.
Although Phreesia’s full-year earnings are still negative, it reduced its losses and improved its EPS by 42% annually over the last five years. The next few quarters will be critical for assessing its long-term profitability.
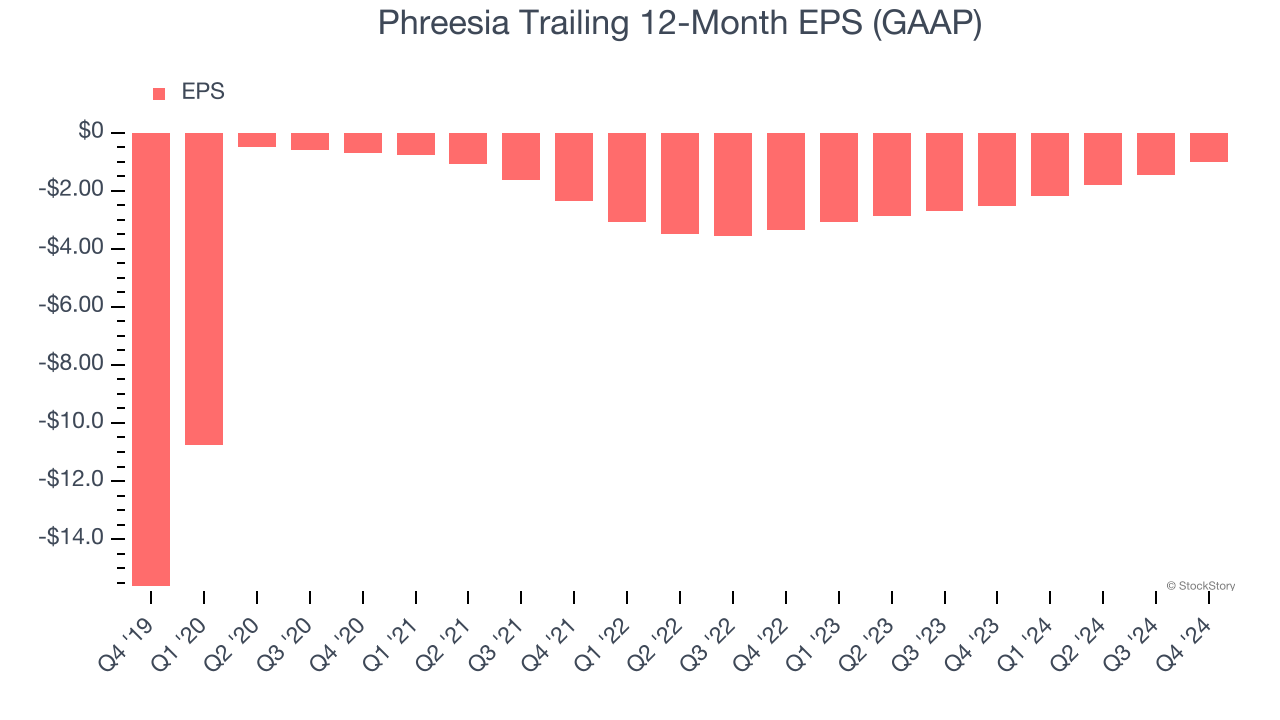
In Q4, Phreesia reported EPS at negative $0.11, up from negative $0.56 in the same quarter last year. This print easily cleared analysts’ estimates, and shareholders should be content with the results. Over the next 12 months, Wall Street is optimistic. Analysts forecast Phreesia’s full-year EPS of negative $1.02 will reach break even.
Key Takeaways from Phreesia’s Q4 Results
We were impressed by how significantly Phreesia blew past analysts’ EPS and EBITDA expectations this quarter. We were also glad its full-year EBITDA guidance exceeded Wall Street’s estimates. Overall, this quarter had some key positives, but the market seemed to be hoping for stronger revenue guidance. The stock traded down 5.5% to $22.57 immediately following the results.
So do we think Phreesia is an attractive buy at the current price? We think that the latest quarter is only one piece of the longer-term business quality puzzle. Quality, when combined with valuation, can help determine if the stock is a buy. We cover that in our actionable full research report which you can read here, it’s free.


