Outdoor lifestyle and recreational products company Solo Brands (NYSE: DTC) fell short of the market’s revenue expectations in Q4 CY2024, with sales falling 13.2% year on year to $143.5 million. Its non-GAAP profit of $0.03 per share was 77.7% below analysts’ consensus estimates.
Is now the time to buy Solo Brands? Find out by accessing our full research report, it’s free.
Solo Brands (DTC) Q4 CY2024 Highlights:
- "Our 2024 Annual Report on Form 10-K discloses that there is substantial doubt about our ability to continue as a going concern. We are evaluating strategies to refinance our existing debt and our plans are focused on improving our results and liquidity through a variety of operational improvements throughout 2025. More information on these topics will be provided on today's conference call."
- Revenue: $143.5 million vs analyst estimates of $159.4 million (13.2% year-on-year decline, 10% miss)
- Adjusted EPS: $0.03 vs analyst expectations of $0.13 (77.7% miss)
- Adjusted EBITDA: $6.32 million vs analyst estimates of $17.11 million (4.4% margin, 63% miss)
- Operating Margin: -38.5%, up from -146% in the same quarter last year
- Free Cash Flow Margin: 7%, down from 12.8% in the same quarter last year
- Market Capitalization: $38.37 million
Company Overview
Started through a Kickstarter campaign, Solo Brands (NYSE: DTC) is a provider of outdoor and recreational products.
Leisure Products
Leisure products cover a wide range of goods in the consumer discretionary sector. Maintaining a strong brand is key to success, and those who differentiate themselves will enjoy customer loyalty and pricing power while those who don’t may find themselves in precarious positions due to the non-essential nature of their offerings.
Sales Growth
A company’s long-term performance is an indicator of its overall quality. Any business can have short-term success, but a top-tier one grows for years. Over the last four years, Solo Brands grew its sales at an incredible 35.9% compounded annual growth rate. Its growth beat the average consumer discretionary company and shows its offerings resonate with customers.
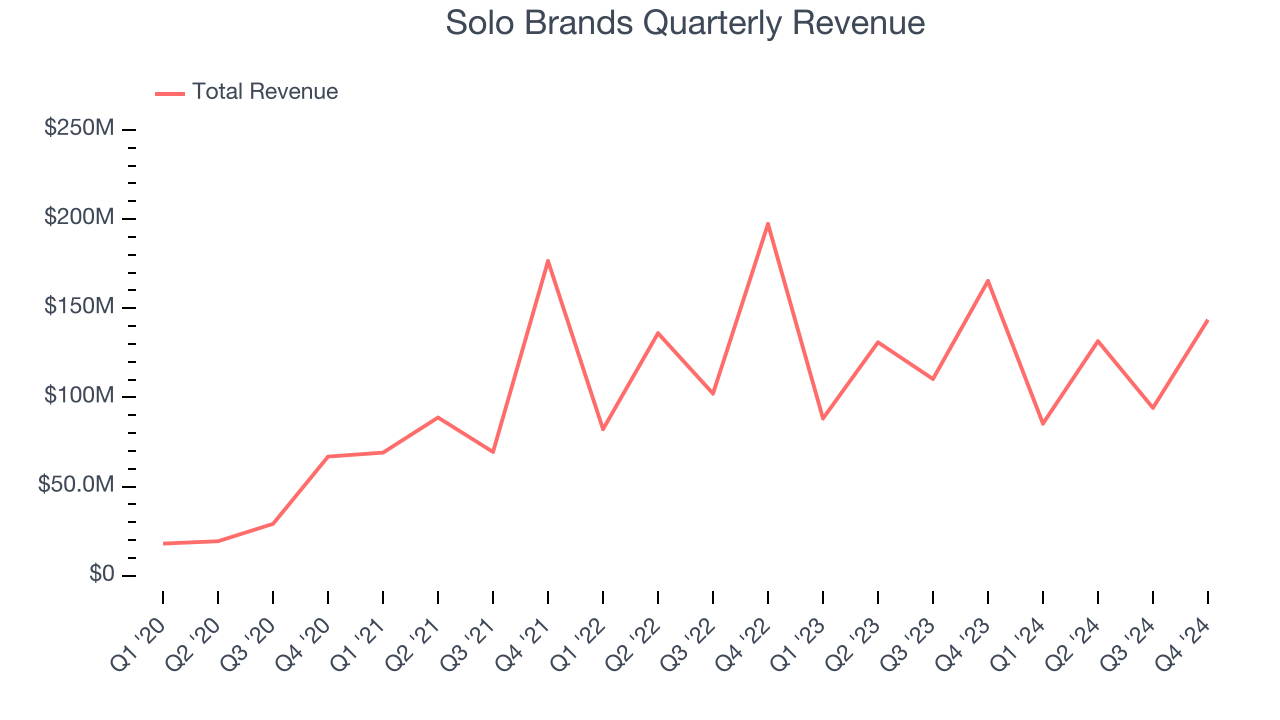
We at StockStory place the most emphasis on long-term growth, but within consumer discretionary, a stretched historical view may miss a company riding a successful new product or trend. Solo Brands’s recent history marks a sharp pivot from its four-year trend as its revenue has shown annualized declines of 6.3% over the last two years. 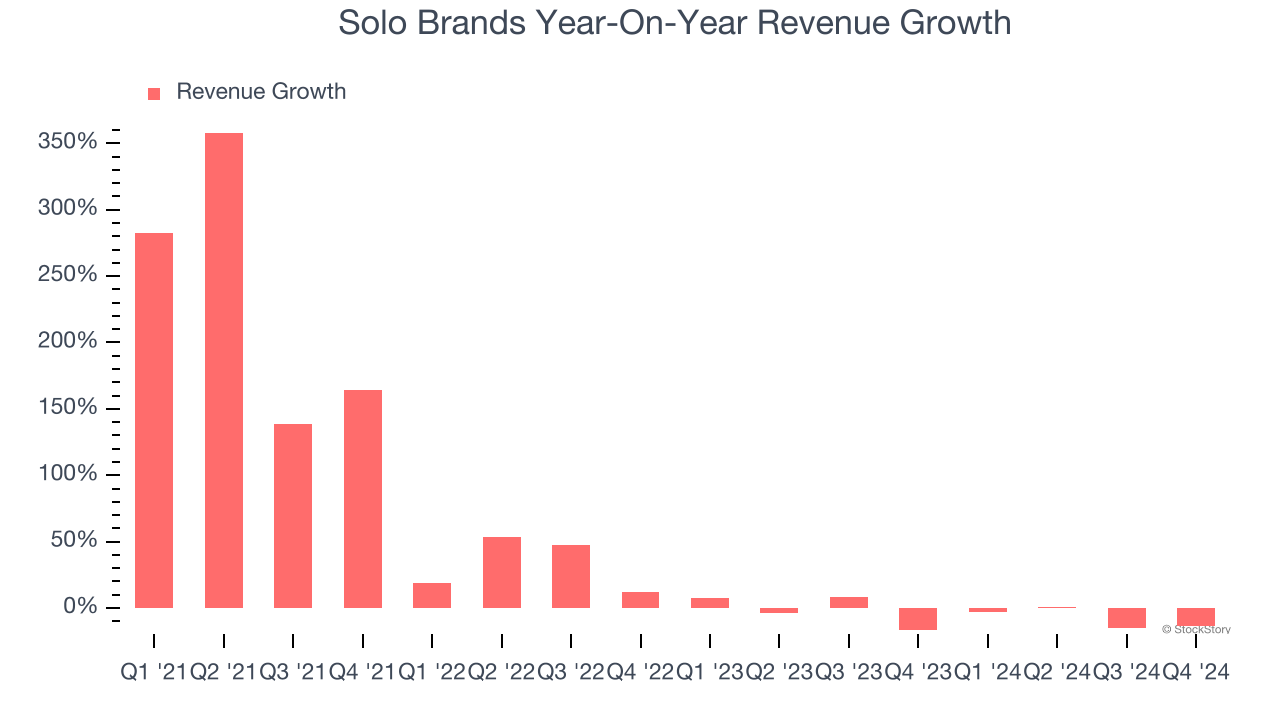
This quarter, Solo Brands missed Wall Street’s estimates and reported a rather uninspiring 13.2% year-on-year revenue decline, generating $143.5 million of revenue.
Looking ahead, sell-side analysts expect revenue to grow 6.3% over the next 12 months. Although this projection indicates its newer products and services will catalyze better top-line performance, it is still below average for the sector.
Unless you’ve been living under a rock, it should be obvious by now that generative AI is going to have a huge impact on how large corporations do business. While Nvidia and AMD are trading close to all-time highs, we prefer a lesser-known (but still profitable) stock benefiting from the rise of AI. Click here to access our free report one of our favorites growth stories.
Operating Margin
Operating margin is an important measure of profitability as it shows the portion of revenue left after accounting for all core expenses – everything from the cost of goods sold to advertising and wages. It’s also useful for comparing profitability across companies with different levels of debt and tax rates because it excludes interest and taxes.
Solo Brands’s operating margin has risen over the last 12 months, but it still averaged negative 42.4% over the last two years. This is due to its large expense base and inefficient cost structure.
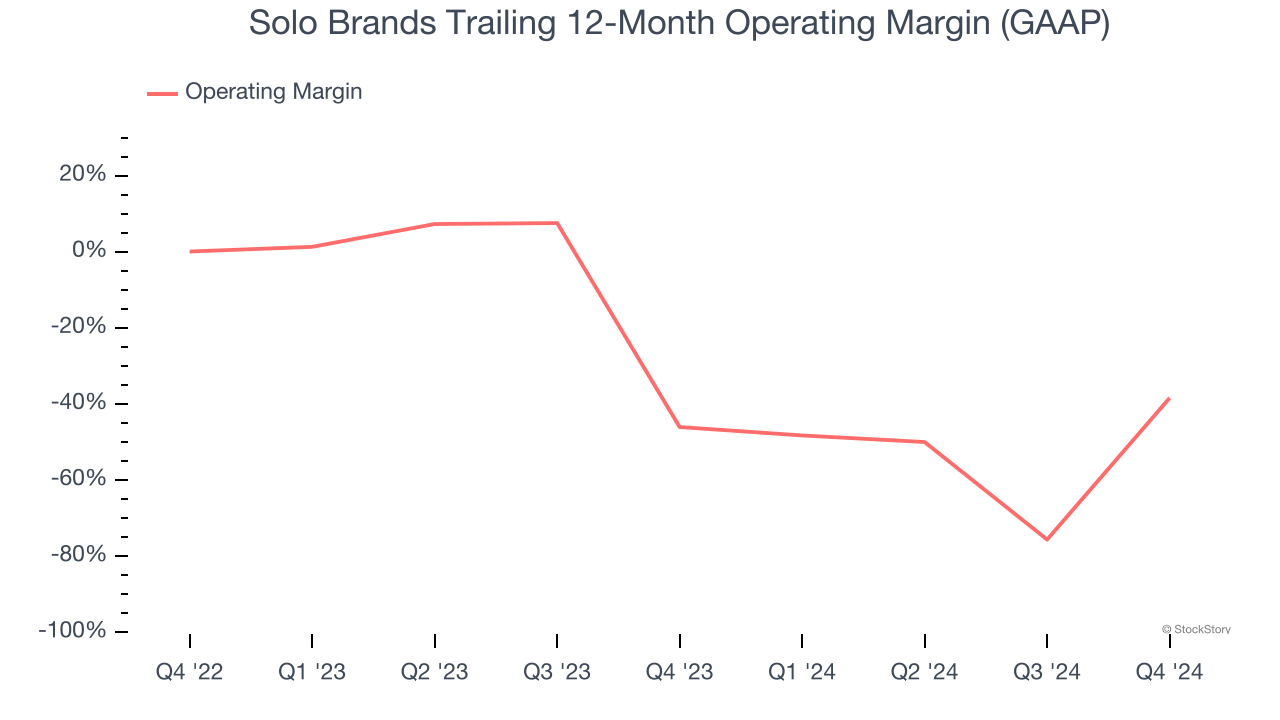
In Q4, Solo Brands generated a negative 38.5% operating margin. The company's consistent lack of profits raise a flag.
Earnings Per Share
We track the long-term change in earnings per share (EPS) for the same reason as long-term revenue growth. Compared to revenue, however, EPS highlights whether a company’s growth is profitable.
Sadly for Solo Brands, its EPS declined by 38.3% annually over the last four years while its revenue grew by 35.9%. We can see the difference stemmed from higher interest expenses or taxes as the company actually grew its operating margin and repurchased its shares during this time.
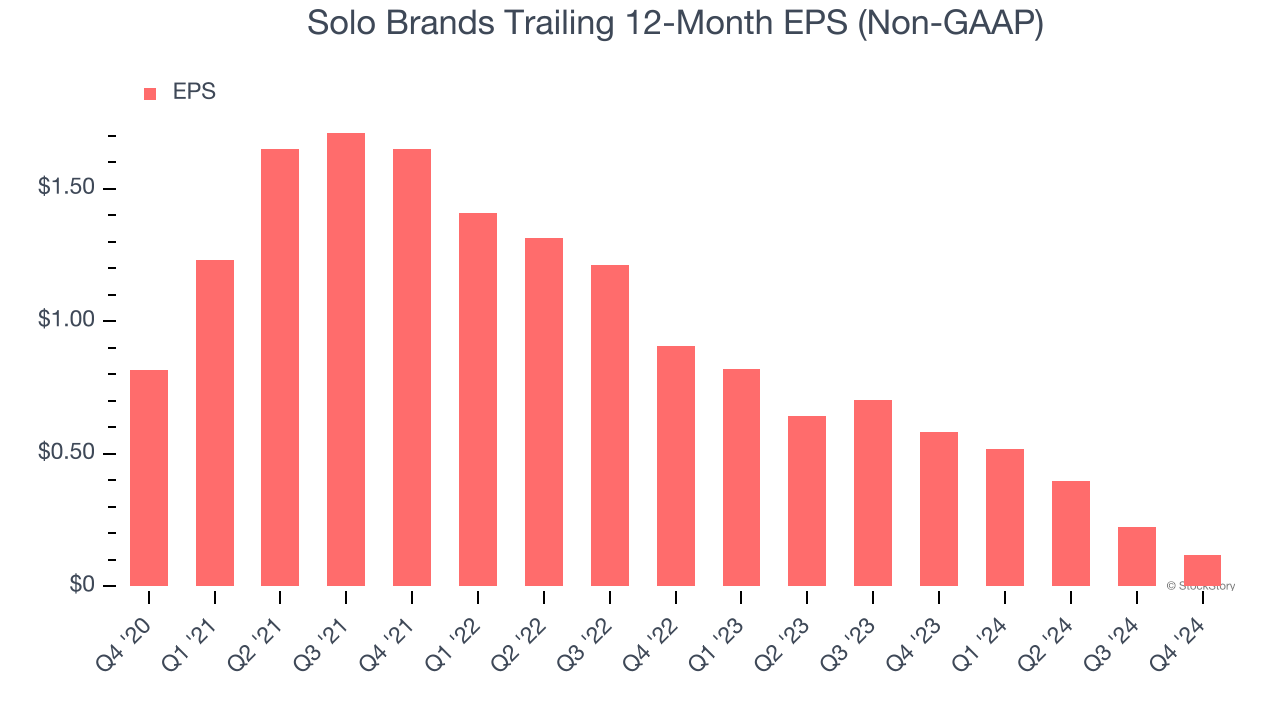
In Q4, Solo Brands reported EPS at $0.03, down from $0.13 in the same quarter last year. This print missed analysts’ estimates. Over the next 12 months, Wall Street expects Solo Brands to perform poorly. Analysts forecast its full-year EPS of $0.12 will hit $0.32.
Key Takeaways from Solo Brands’s Q4 Results
We struggled to find many positives in these results. Its revenue missed significantly and its EBITDA fell short of Wall Street’s estimates. Overall, this quarter could have been better.
Furthermore, the company said "Our 2024 Annual Report on Form 10-K discloses that there is substantial doubt about our ability to continue as a going concern. We are evaluating strategies to refinance our existing debt and our plans are focused on improving our results and liquidity through a variety of operational improvements throughout 2025. More information on these topics will be provided on today's conference call."
The stock traded down 19.2% to $0.52 immediately following the results.
Solo Brands didn’t show it’s best hand this quarter, but does that create an opportunity to buy the stock right now? We think that the latest quarter is only one piece of the longer-term business quality puzzle. Quality, when combined with valuation, can help determine if the stock is a buy. We cover that in our actionable full research report which you can read here, it’s free.