
Novanta’s stock price has taken a beating over the past six months, shedding 21.9% of its value and falling to a new 52-week low of $133.58 per share. This was partly due to its softer quarterly results and might have investors contemplating their next move.
Is there a buying opportunity in Novanta, or does it present a risk to your portfolio? Get the full stock story straight from our expert analysts, it’s free.
Even with the cheaper entry price, we're cautious about Novanta. Here are three reasons why NOVT doesn't excite us and a stock we'd rather own.
Why Is Novanta Not Exciting?
Originally a pioneer in the laser scanning industry during the late 1960s, Novanta (NASDAQ: NOVT) offers medicine and manufacturing technology to the medical, life sciences, and manufacturing industries.
1. Lackluster Revenue Growth
Long-term growth is the most important, but within industrials, a stretched historical view may miss new industry trends or demand cycles. Novanta’s recent history shows its demand has slowed as its annualized revenue growth of 5% over the last two years was below its five-year trend. 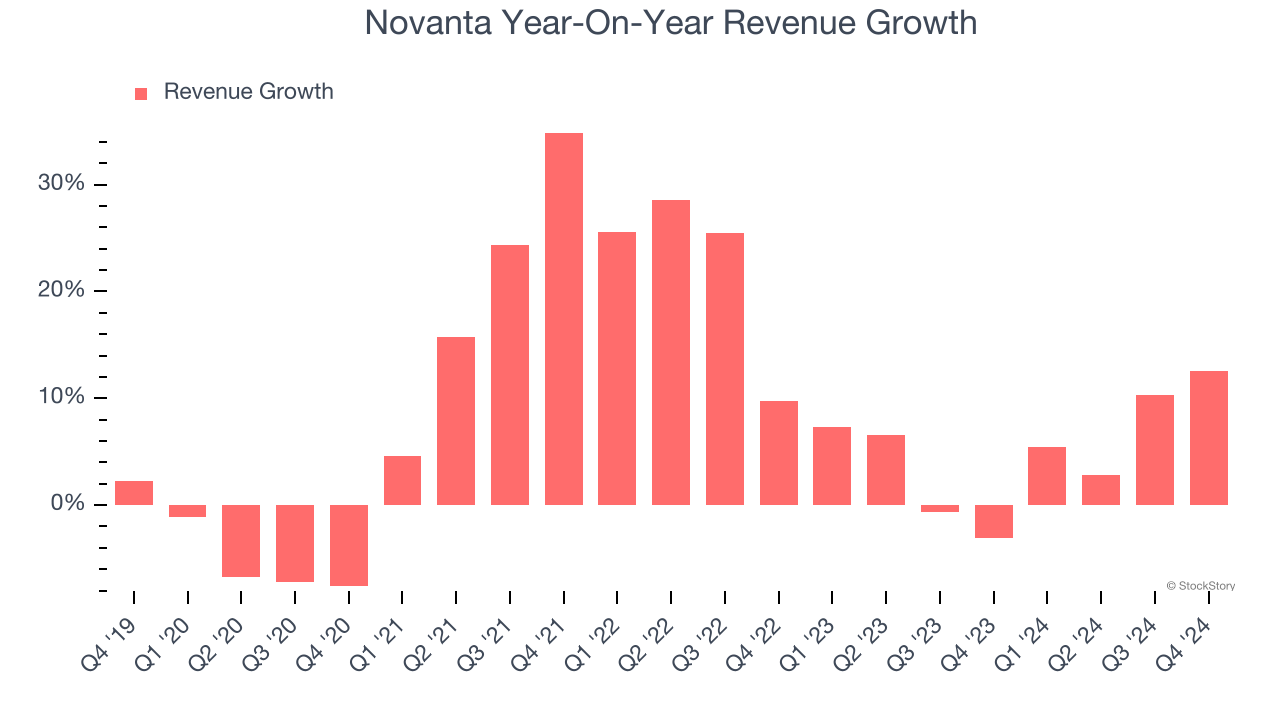
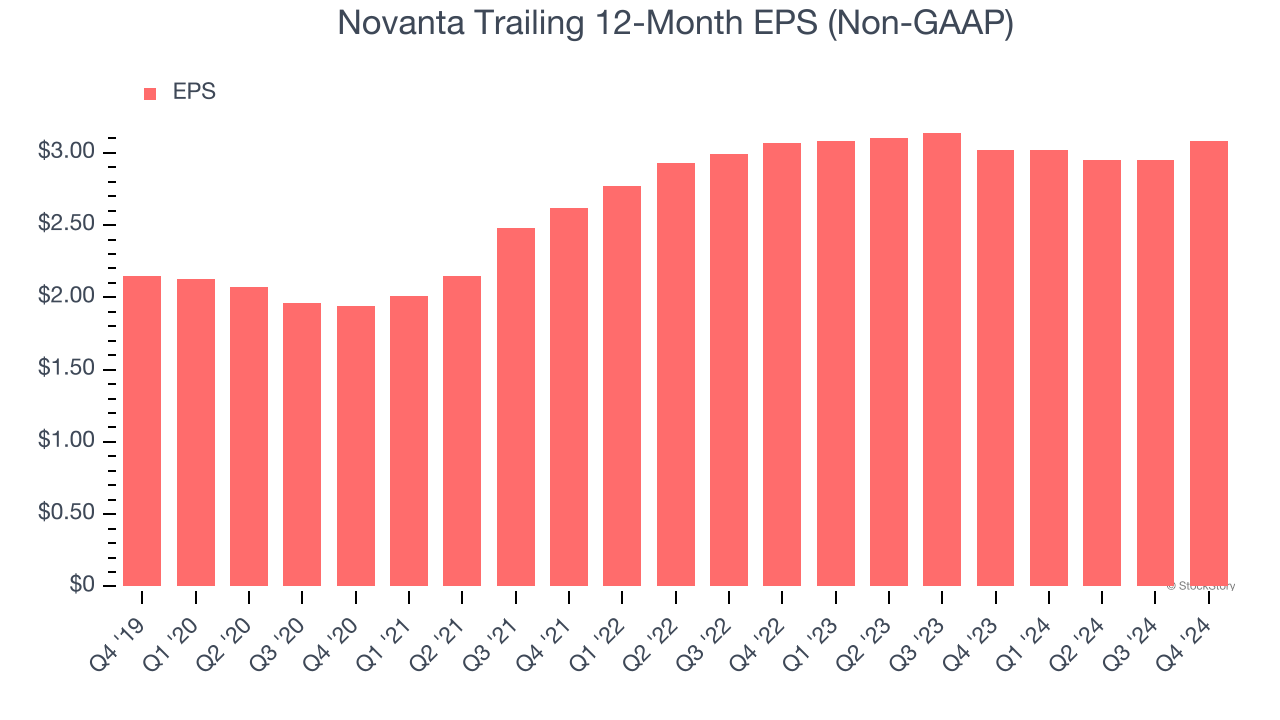
2. EPS Barely Growing
Analyzing the long-term change in earnings per share (EPS) shows whether a company's incremental sales were profitable – for example, revenue could be inflated through excessive spending on advertising and promotions.
Novanta’s EPS grew at an unimpressive 7.5% compounded annual growth rate over the last five years, lower than its 8.7% annualized revenue growth. This tells us the company became less profitable on a per-share basis as it expanded.
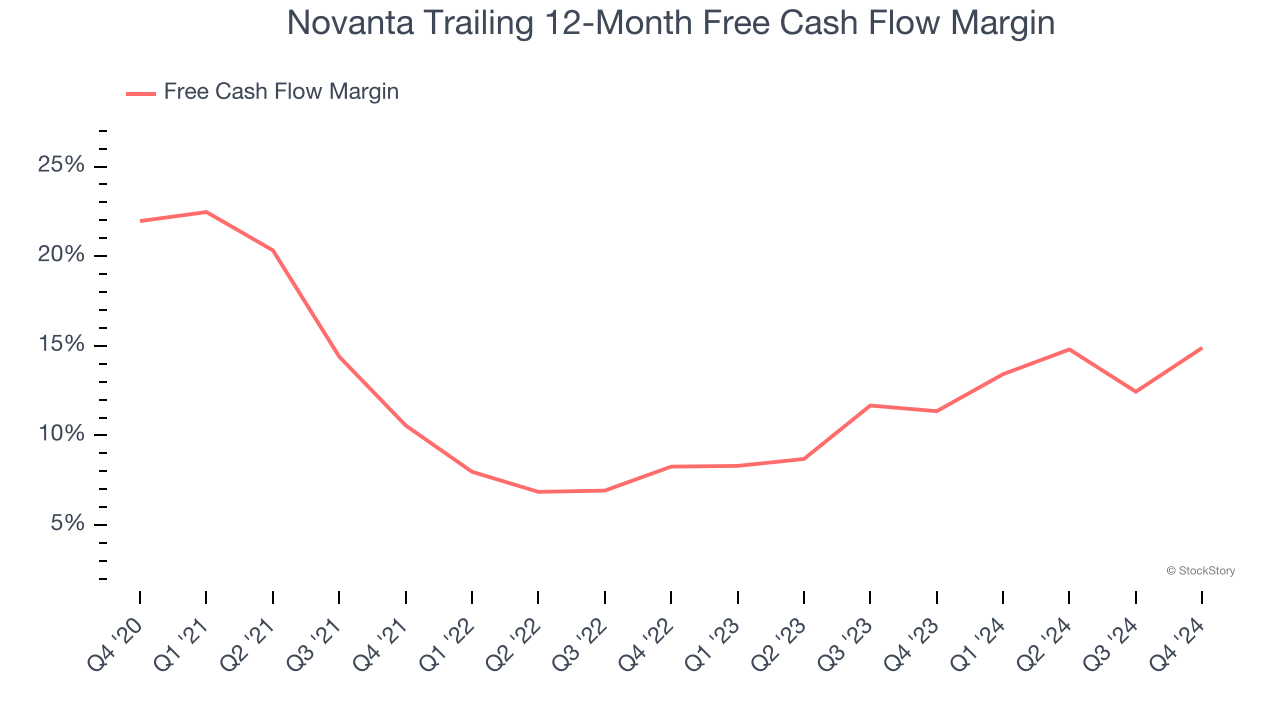
3. Free Cash Flow Margin Dropping
Free cash flow isn't a prominently featured metric in company financials and earnings releases, but we think it's telling because it accounts for all operating and capital expenses, making it tough to manipulate. Cash is king.
As you can see below, Novanta’s margin dropped by 7.1 percentage points over the last five years. It may have ticked higher more recently, but shareholders are likely hoping for its margin to at least revert to its historical level. If the longer-term trend returns, it could signal increasing investment needs and capital intensity. Novanta’s free cash flow margin for the trailing 12 months was 14.9%.
Final Judgment
Novanta isn’t a terrible business, but it doesn’t pass our quality test. After the recent drawdown, the stock trades at 35.9× forward price-to-earnings (or $133.58 per share). This multiple tells us a lot of good news is priced in - we think there are better stocks to buy right now. We’d suggest looking at our favorite semiconductor picks and shovels play.
Stocks We Like More Than Novanta
With rates dropping, inflation stabilizing, and the elections in the rearview mirror, all signs point to the start of a new bull run - and we’re laser-focused on finding the best stocks for this upcoming cycle.
Put yourself in the driver’s seat by checking out our Top 5 Growth Stocks for this month. This is a curated list of our High Quality stocks that have generated a market-beating return of 175% over the last five years.
Stocks that made our list in 2019 include now familiar names such as Nvidia (+2,183% between December 2019 and December 2024) as well as under-the-radar businesses like Sterling Infrastructure (+1,096% five-year return). Find your next big winner with StockStory today for free.


