Over the past six months, Vishay Intertechnology’s shares (currently trading at $17.15) have posted a disappointing 7.2% loss while the S&P 500 was down 1.4%. This was partly driven by its softer quarterly results and might have investors contemplating their next move.
Is there a buying opportunity in Vishay Intertechnology, or does it present a risk to your portfolio? Check out our in-depth research report to see what our analysts have to say, it’s free.
Even though the stock has become cheaper, we're cautious about Vishay Intertechnology. Here are three reasons why we avoid VSH and a stock we'd rather own.
Why Do We Think Vishay Intertechnology Will Underperform?
Named after the founder's ancestral village in present-day Lithuania, Vishay Intertechnology (NYSE: VSH) manufactures simple chips and electronic components that are building blocks of virtually all types of electronic devices.
1. Long-Term Revenue Growth Disappoints
Examining a company’s long-term performance can provide clues about its quality. Any business can put up a good quarter or two, but many enduring ones grow for years. Over the last five years, Vishay Intertechnology grew its sales at a sluggish 1.9% compounded annual growth rate. This was below our standards. Semiconductors are a cyclical industry, and long-term investors should be prepared for periods of high growth followed by periods of revenue contractions.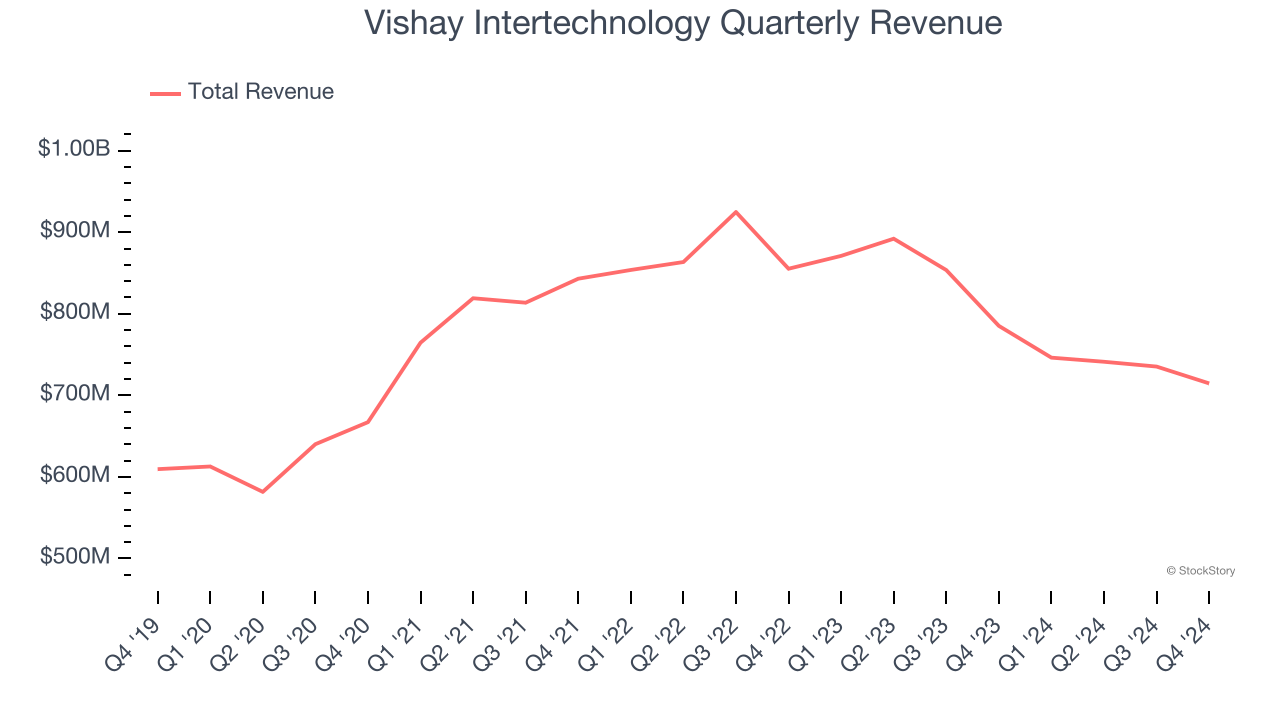
2. Low Gross Margin Reveals Weak Structural Profitability
In the semiconductor industry, a company’s gross profit margin is a critical metric to track because it sheds light on its pricing power, complexity of products, and ability to procure raw materials, equipment, and labor.
Vishay Intertechnology’s gross margin is one of the worst in the semiconductor industry, signaling it operates in a competitive market and lacks pricing power. As you can see below, it averaged a 25.3% gross margin over the last two years. Said differently, Vishay Intertechnology had to pay a chunky $74.75 to its suppliers for every $100 in revenue. 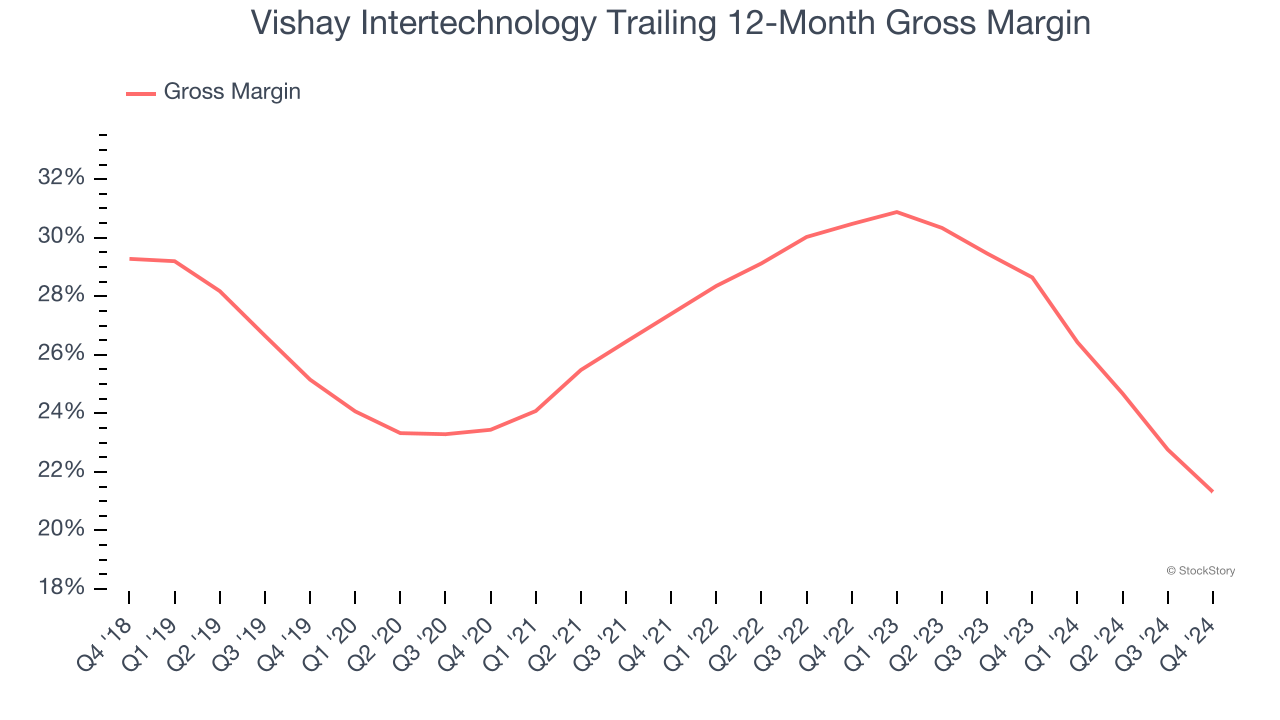
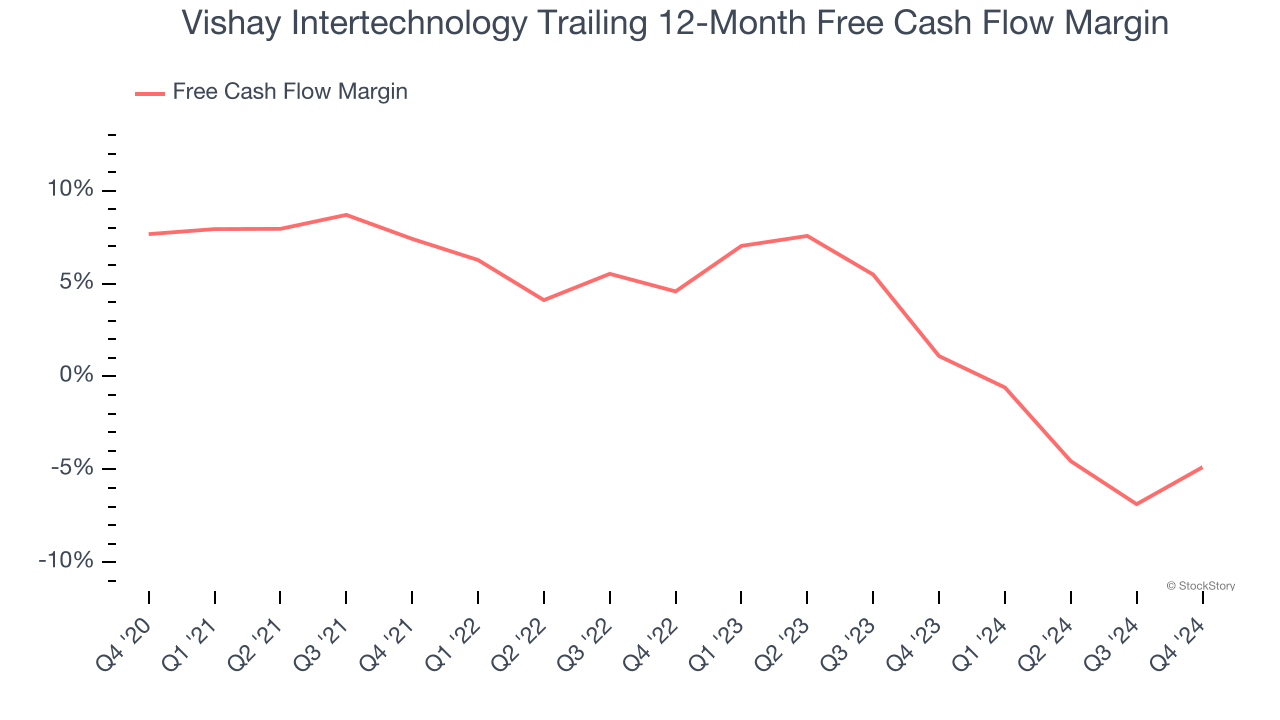
3. Free Cash Flow Margin Dropping
Free cash flow isn't a prominently featured metric in company financials and earnings releases, but we think it's telling because it accounts for all operating and capital expenses, making it tough to manipulate. Cash is king.
As you can see below, Vishay Intertechnology’s margin dropped by 12.5 percentage points over the last five years. Almost any movement in the wrong direction is undesirable because it is already burning cash. If the trend continues, it could signal it’s becoming a more capital-intensive business. Vishay Intertechnology’s free cash flow margin for the trailing 12 months was negative 4.9%.
Final Judgment
Vishay Intertechnology falls short of our quality standards. Following the recent decline, the stock trades at 21.7× forward price-to-earnings (or $17.15 per share). This valuation tells us a lot of optimism is priced in - we think there are better stocks to buy right now. Let us point you toward one of our top digital advertising picks.
Stocks We Like More Than Vishay Intertechnology
With rates dropping, inflation stabilizing, and the elections in the rearview mirror, all signs point to the start of a new bull run - and we’re laser-focused on finding the best stocks for this upcoming cycle.
Put yourself in the driver’s seat by checking out our Top 9 Market-Beating Stocks. This is a curated list of our High Quality stocks that have generated a market-beating return of 175% over the last five years.
Stocks that made our list in 2019 include now familiar names such as Nvidia (+2,183% between December 2019 and December 2024) as well as under-the-radar businesses like Comfort Systems (+751% five-year return). Find your next big winner with StockStory today for free.