
Over the past six months, Match Group’s shares (currently trading at $31.64) have posted a disappointing 14% loss while the S&P 500 was down 1.4%. This was partly due to its softer quarterly results and might have investors contemplating their next move.
Is there a buying opportunity in Match Group, or does it present a risk to your portfolio? Check out our in-depth research report to see what our analysts have to say, it’s free.
Even though the stock has become cheaper, we're sitting this one out for now. Here are three reasons why there are better opportunities than MTCH and a stock we'd rather own.
Why Is Match Group Not Exciting?
Originally started as a dial-up service before widespread internet adoption, Match (NASDAQ: MTCH) was an early innovator in online dating and today has a portfolio of apps including Tinder, Hinge, Archer, and OkCupid.
1. Declining Payers Reflect Product Weakness
As a subscription-based app, Match Group generates revenue growth by expanding both its subscriber base and the amount each subscriber spends over time.
Match Group struggled with new customer acquisition over the last two years as its payers have declined by 4.5% annually to 14.61 million in the latest quarter. This performance isn't ideal because internet usage is secular, meaning there are typically unaddressed market opportunities. If Match Group wants to accelerate growth, it likely needs to enhance the appeal of its current offerings or innovate with new products. 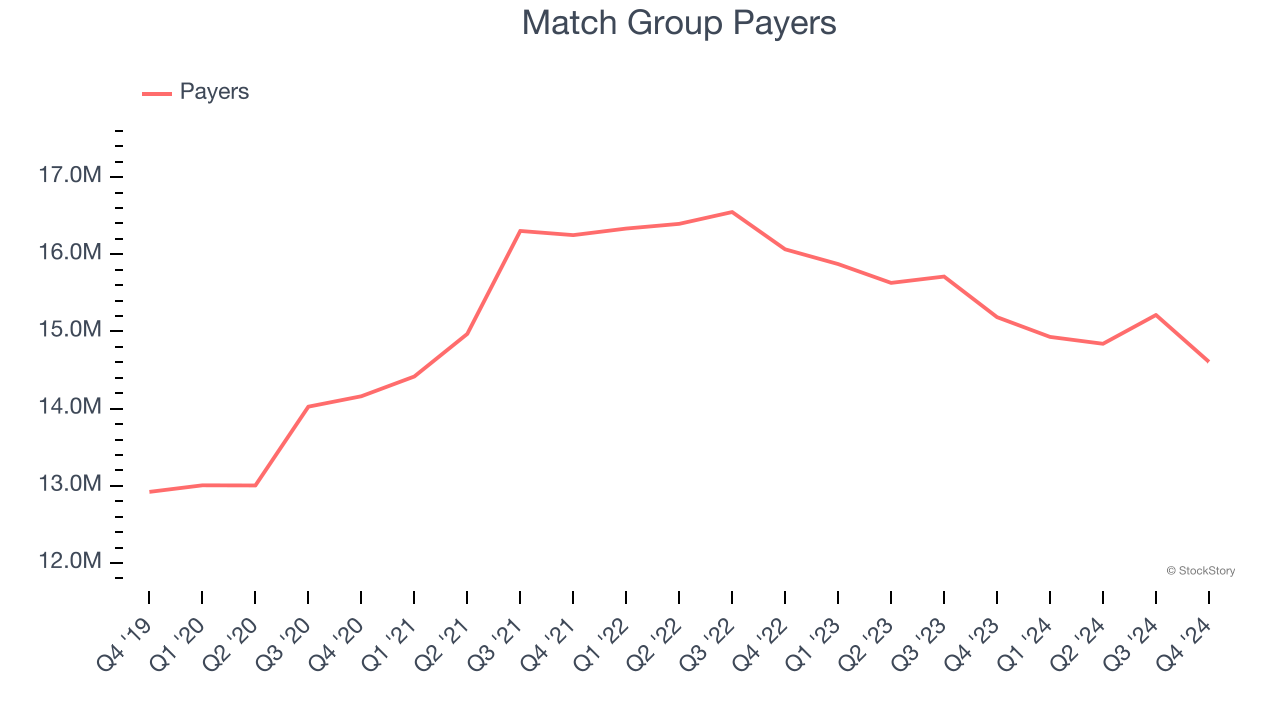
2. Projected Revenue Growth Shows Limited Upside
Forecasted revenues by Wall Street analysts signal a company’s potential. Predictions may not always be accurate, but accelerating growth typically boosts valuation multiples and stock prices while slowing growth does the opposite.
Over the next 12 months, sell-side analysts expect Match Group’s revenue to stall, a deceleration versus its 5.3% annualized growth for the past three years. This projection is underwhelming and implies its products and services will face some demand challenges.
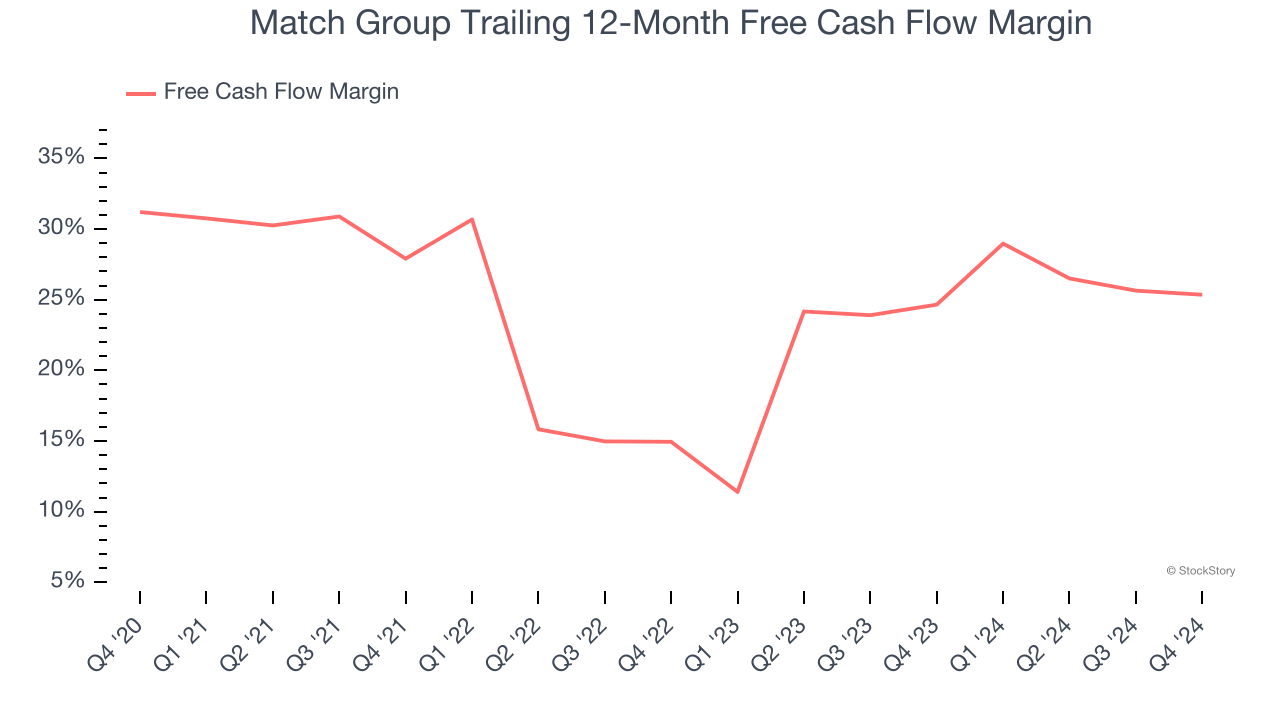
3. Free Cash Flow Margin Dropping
Free cash flow isn't a prominently featured metric in company financials and earnings releases, but we think it's telling because it accounts for all operating and capital expenses, making it tough to manipulate. Cash is king.
As you can see below, Match Group’s margin dropped by 2.6 percentage points over the last few years. If its declines continue, it could signal increasing investment needs and capital intensity. Match Group’s free cash flow margin for the trailing 12 months was 25.4%.
Final Judgment
Match Group isn’t a terrible business, but it isn’t one of our picks. After the recent drawdown, the stock trades at 6.7× forward EV-to-EBITDA (or $31.64 per share). This valuation is reasonable, but the company’s shakier fundamentals present too much downside risk. We're pretty confident there are more exciting stocks to buy at the moment. Let us point you toward one of our top software and edge computing picks.
Stocks We Like More Than Match Group
With rates dropping, inflation stabilizing, and the elections in the rearview mirror, all signs point to the start of a new bull run - and we’re laser-focused on finding the best stocks for this upcoming cycle.
Put yourself in the driver’s seat by checking out our Top 6 Stocks for this week. This is a curated list of our High Quality stocks that have generated a market-beating return of 175% over the last five years.
Stocks that made our list in 2019 include now familiar names such as Nvidia (+2,183% between December 2019 and December 2024) as well as under-the-radar businesses like Comfort Systems (+751% five-year return). Find your next big winner with StockStory today for free.


