Over the past six months, IDEX’s shares (currently trading at $184.50) have posted a disappointing 13.2% loss while the S&P 500 was flat. This was partly due to its softer quarterly results and may have investors wondering how to approach the situation.
Is now the time to buy IDEX, or should you be careful about including it in your portfolio? Get the full breakdown from our expert analysts, it’s free.
Even though the stock has become cheaper, we're sitting this one out for now. Here are three reasons why IEX doesn't excite us and a stock we'd rather own.
Why Do We Think IDEX Will Underperform?
Founded in 1988, IDEX (NYSE: IEX) is a global manufacturer specializing in highly engineered products such as pumps, flow meters, and fluidics systems for various industries.
1. Core Business Falling Behind as Demand Declines
In addition to reported revenue, organic revenue is a useful data point for analyzing Gas and Liquid Handling companies. This metric gives visibility into IDEX’s core business because it excludes one-time events such as mergers, acquisitions, and divestitures along with foreign currency fluctuations - non-fundamental factors that can manipulate the income statement.
Over the last two years, IDEX’s organic revenue averaged 1.2% year-on-year declines. This performance was underwhelming and implies it may need to improve its products, pricing, or go-to-market strategy. It also suggests IDEX might have to lean into acquisitions to grow, which isn’t ideal because M&A can be expensive and risky (integrations often disrupt focus). 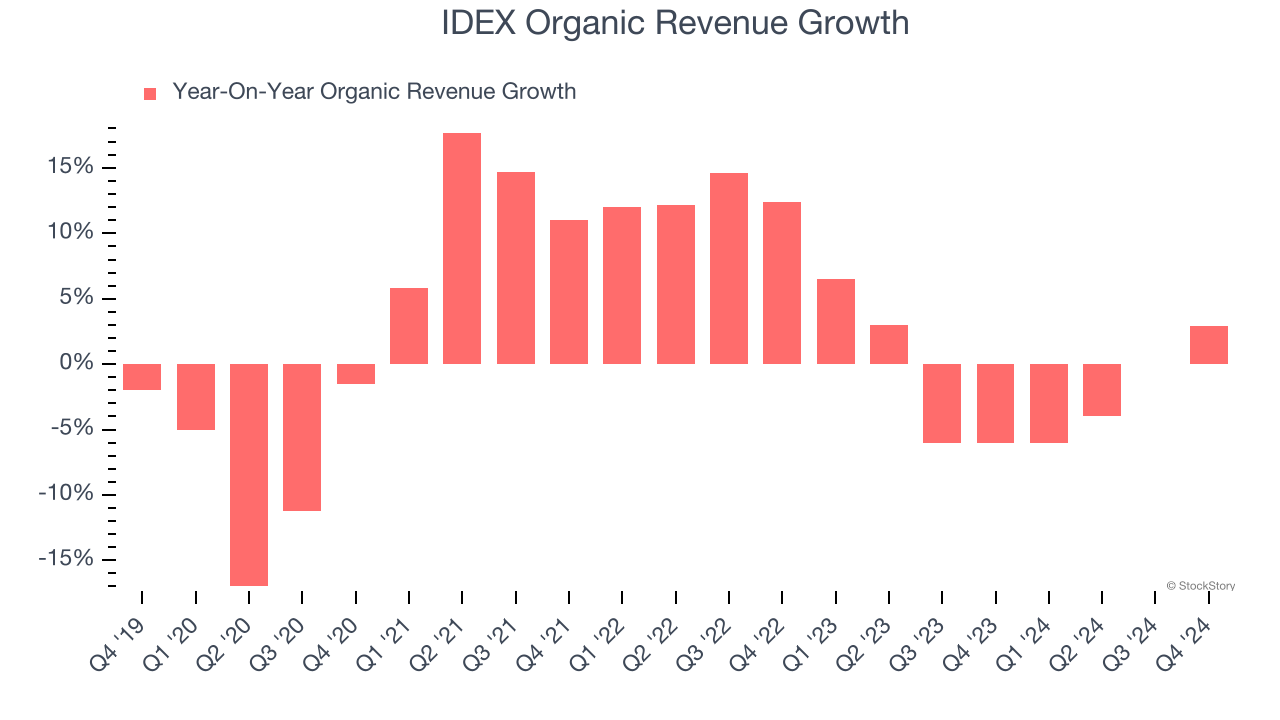
2. EPS Barely Growing
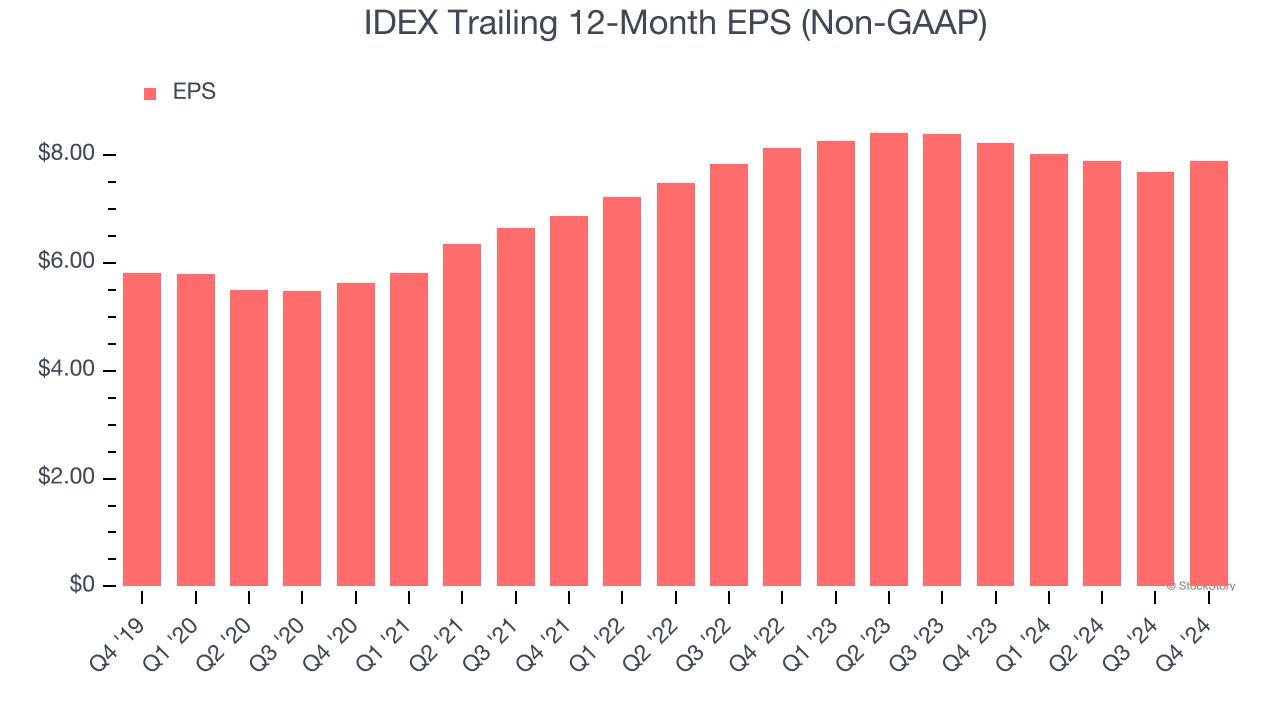
Analyzing the long-term change in earnings per share (EPS) shows whether a company's incremental sales were profitable – for example, revenue could be inflated through excessive spending on advertising and promotions.
IDEX’s unimpressive 6.3% annual EPS growth over the last five years aligns with its revenue performance. This tells us it maintained its per-share profitability as it expanded.
3. New Investments Fail to Bear Fruit as ROIC Declines
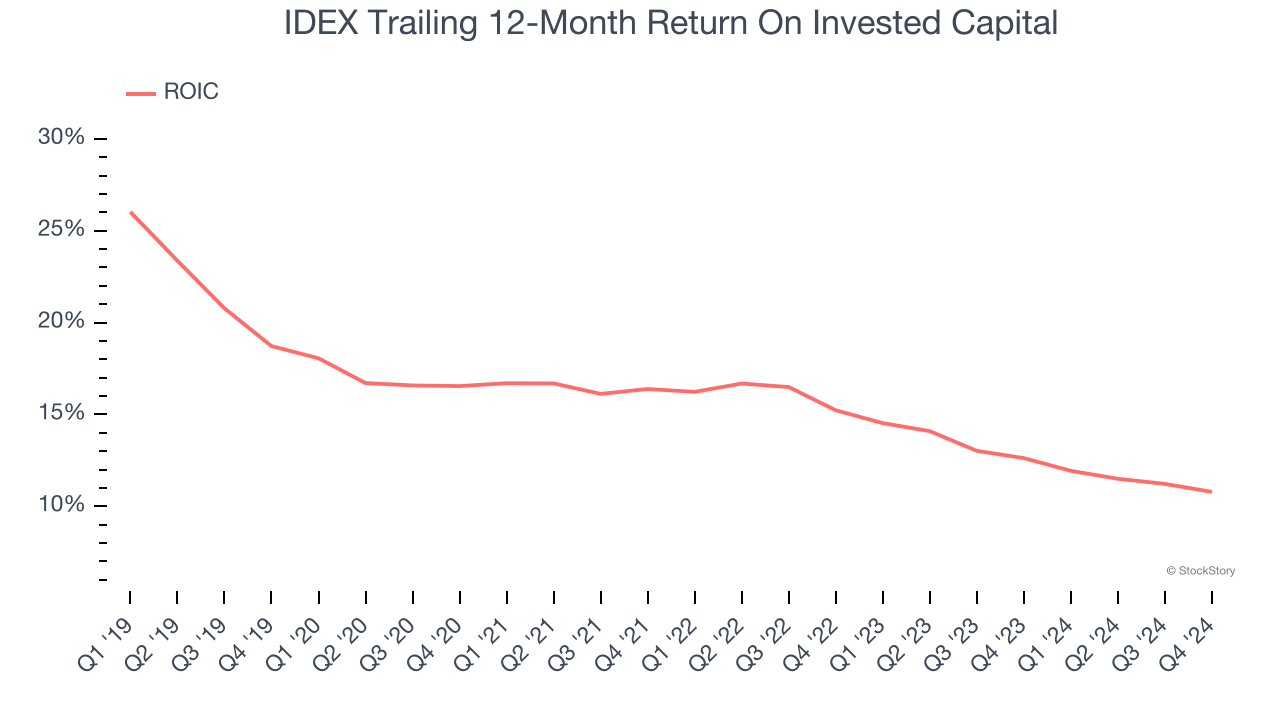
A company’s ROIC, or return on invested capital, shows how much operating profit it makes compared to the money it has raised (debt and equity).
We like to invest in businesses with high returns, but the trend in a company’s ROIC is what often surprises the market and moves the stock price. On average, IDEX’s ROIC decreased by 4.8 percentage points annually over the last few years. We like what management has done in the past, but its declining returns are perhaps a symptom of fewer profitable growth opportunities.
Final Judgment
We cheer for all companies making their customers lives easier, but in the case of IDEX, we’ll be cheering from the sidelines. After the recent drawdown, the stock trades at 21.3× forward price-to-earnings (or $184.50 per share). This valuation tells us a lot of optimism is priced in - we think there are better stocks to buy right now. We’d recommend looking at a dominant Aerospace business that has perfected its M&A strategy.
Stocks We Like More Than IDEX
The elections are now behind us. With rates dropping and inflation cooling, many analysts expect a breakout market - and we’re zeroing in on the stocks that could benefit immensely.
Take advantage of the rebound by checking out our Top 5 Growth Stocks for this month. This is a curated list of our High Quality stocks that have generated a market-beating return of 175% over the last five years.
Stocks that made our list in 2019 include now familiar names such as Nvidia (+2,183% between December 2019 and December 2024) as well as under-the-radar businesses like Comfort Systems (+751% five-year return). Find your next big winner with StockStory today for free.