Over the last six months, Timken’s shares have sunk to $76.64, producing a disappointing 6.7% loss while the S&P 500 was flat. This might have investors contemplating their next move.
Is there a buying opportunity in Timken, or does it present a risk to your portfolio? Get the full breakdown from our expert analysts, it’s free.
Despite the more favorable entry price, we're sitting this one out for now. Here are three reasons why there are better opportunities than TKR and a stock we'd rather own.
Why Do We Think Timken Will Underperform?
Established after the founder noticed the difficulty freight wagons had making sharp turns, Timken (NYSE: TKR) is a provider of industrial parts used across various sectors.
1. Core Business Falling Behind as Demand Declines
Investors interested in Engineered Components and Systems companies should track organic revenue in addition to reported revenue. This metric gives visibility into Timken’s core business because it excludes one-time events such as mergers, acquisitions, and divestitures along with foreign currency fluctuations - non-fundamental factors that can manipulate the income statement.
Over the last two years, Timken’s organic revenue averaged 2.3% year-on-year declines. This performance was underwhelming and implies it may need to improve its products, pricing, or go-to-market strategy. It also suggests Timken might have to lean into acquisitions to grow, which isn’t ideal because M&A can be expensive and risky (integrations often disrupt focus). 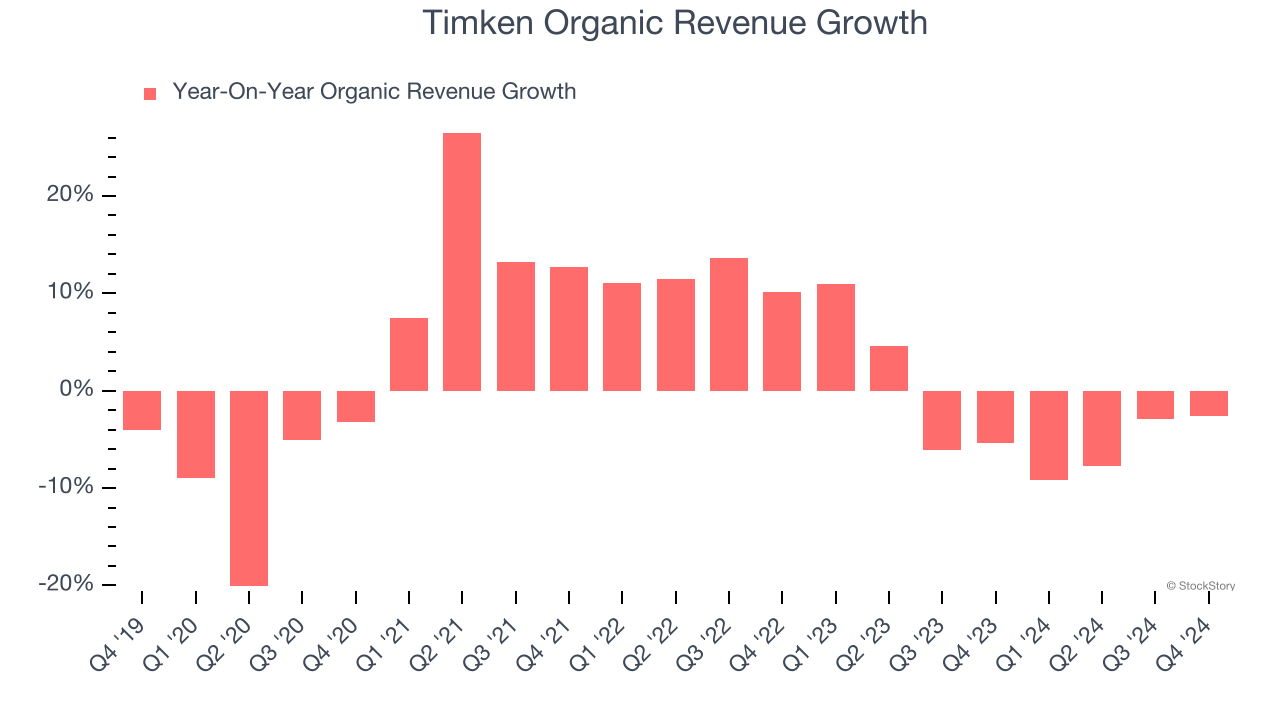
2. EPS Barely Growing
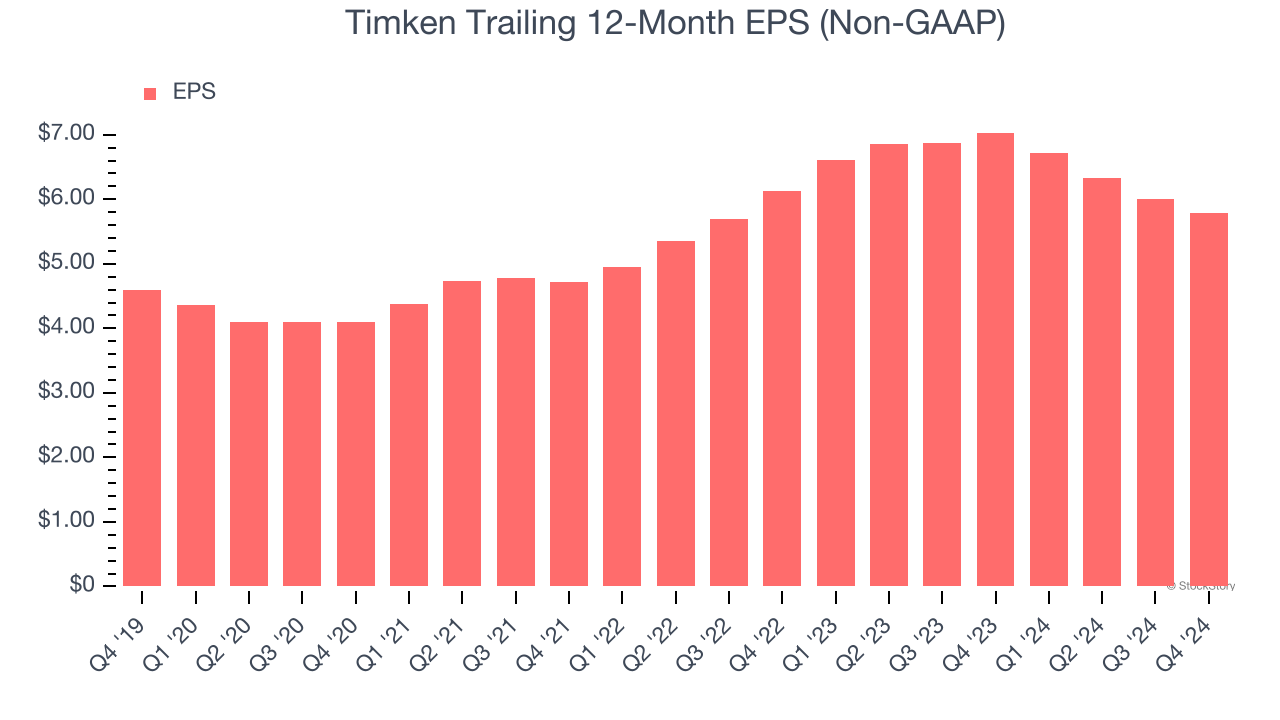
Analyzing the long-term change in earnings per share (EPS) shows whether a company's incremental sales were profitable – for example, revenue could be inflated through excessive spending on advertising and promotions.
Timken’s unimpressive 4.7% annual EPS growth over the last five years aligns with its revenue performance. This tells us it maintained its per-share profitability as it expanded.
3. Free Cash Flow Margin Dropping
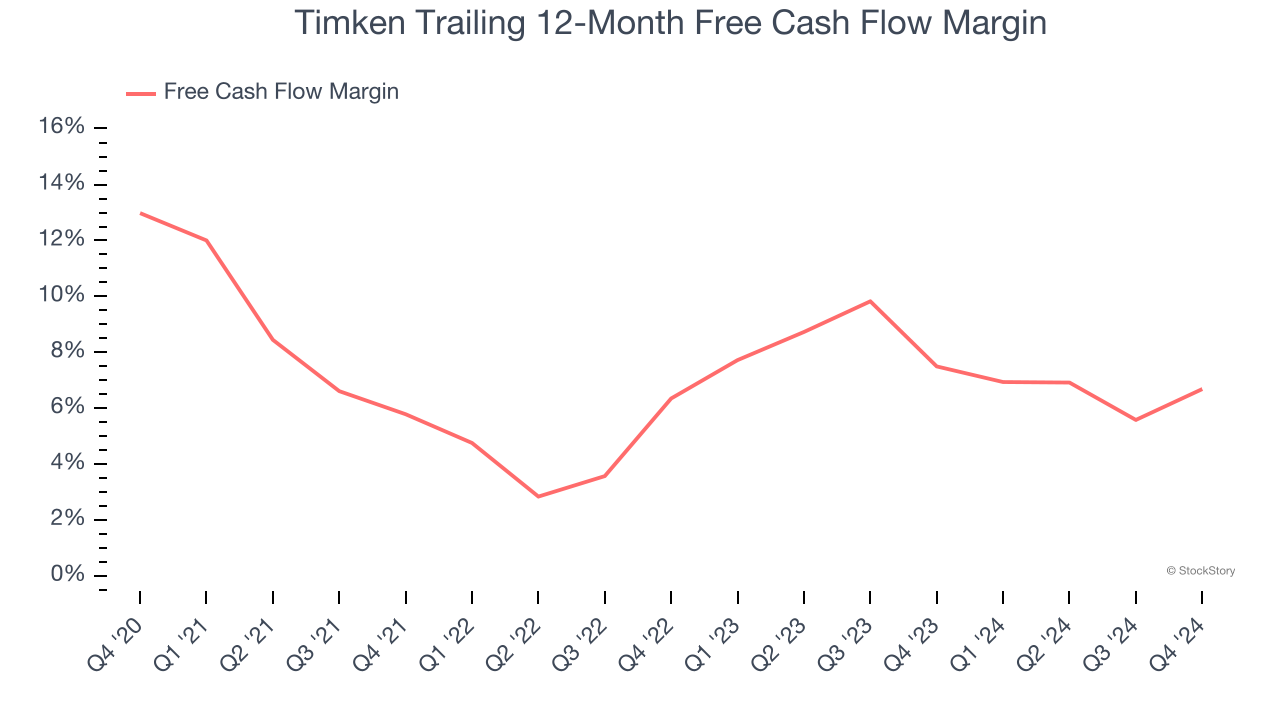
If you’ve followed StockStory for a while, you know we emphasize free cash flow. Why, you ask? We believe that in the end, cash is king, and you can’t use accounting profits to pay the bills.
As you can see below, Timken’s margin dropped by 6.3 percentage points over the last five years. If its declines continue, it could signal increasing investment needs and capital intensity. Timken’s free cash flow margin for the trailing 12 months was 6.7%.
Final Judgment
We see the value of companies helping their customers, but in the case of Timken, we’re out. Following the recent decline, the stock trades at 12× forward price-to-earnings (or $76.64 per share). While this valuation is reasonable, we don’t see a big opportunity at the moment. There are superior stocks to buy right now. We’d recommend looking at the most dominant software business in the world.
Stocks We Like More Than Timken
The Trump trade may have passed, but rates are still dropping and inflation is still cooling. Opportunities are ripe for those ready to act - and we’re here to help you pick them.
Get started by checking out our Top 9 Market-Beating Stocks. This is a curated list of our High Quality stocks that have generated a market-beating return of 175% over the last five years.
Stocks that made our list in 2019 include now familiar names such as Nvidia (+2,183% between December 2019 and December 2024) as well as under-the-radar businesses like Comfort Systems (+751% five-year return). Find your next big winner with StockStory today for free.