
Levi's has gotten torched over the last six months - since September 2024, its stock price has dropped 23.3% to $16.01 per share. This may have investors wondering how to approach the situation.
Is there a buying opportunity in Levi's, or does it present a risk to your portfolio? See what our analysts have to say in our full research report, it’s free.
Even with the cheaper entry price, we're swiping left on Levi's for now. Here are three reasons why we avoid LEVI and a stock we'd rather own.
Why Do We Think Levi's Will Underperform?
Credited for inventing the first pair of blue jeans in 1873, Levi's (NYSE: LEVI) is an apparel company renowned for its iconic denim products and classic American style.
1. Weak Constant Currency Growth Points to Soft Demand
Investors interested in Apparel and Accessories companies should track constant currency revenue in addition to reported revenue. This metric excludes currency movements, which are outside of Levi’s control and are not indicative of underlying demand.
Over the last two years, Levi’s constant currency revenue averaged 1.4% year-on-year growth. This performance was underwhelming and suggests it might have to lower prices or invest in product improvements to accelerate growth, factors that can hinder near-term profitability. 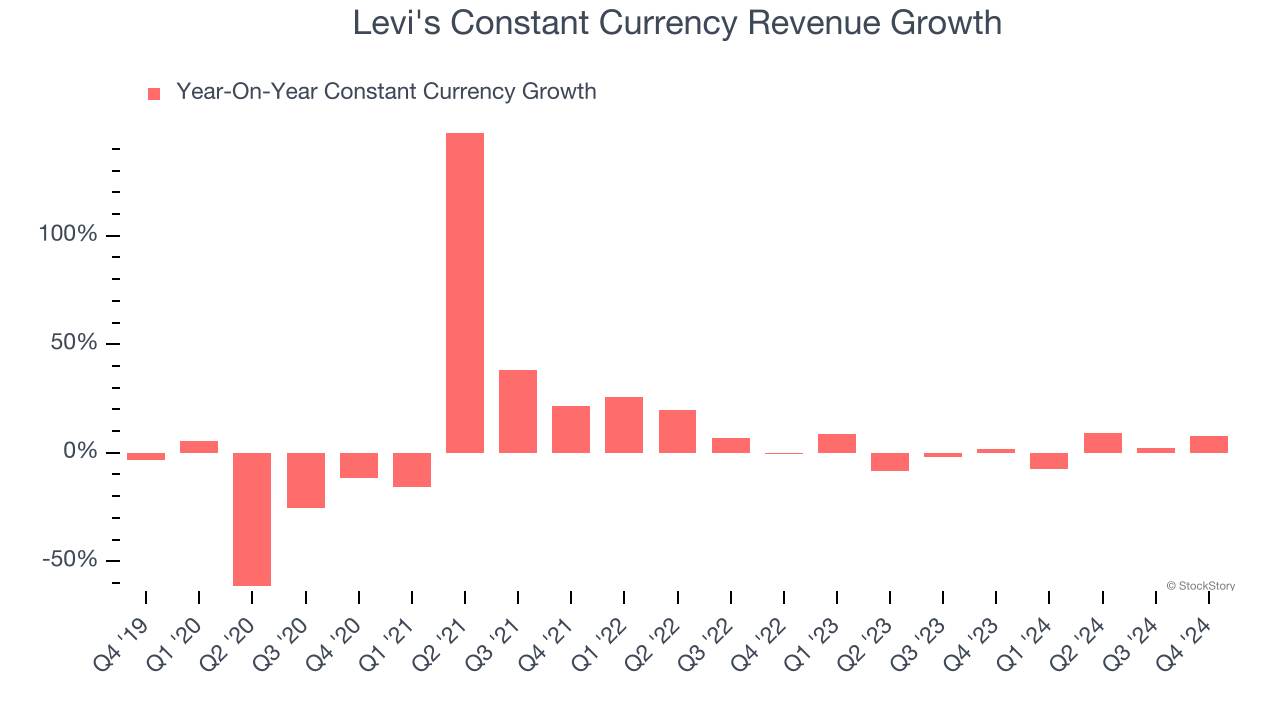
2. Revenue Projections Show Stormy Skies Ahead
Forecasted revenues by Wall Street analysts signal a company’s potential. Predictions may not always be accurate, but accelerating growth typically boosts valuation multiples and stock prices while slowing growth does the opposite.
Over the next 12 months, sell-side analysts expect Levi’s revenue to drop by 1.1%, a decrease from its 1.5% annualized growth for the past two years. This projection doesn't excite us and indicates its products and services will face some demand challenges.
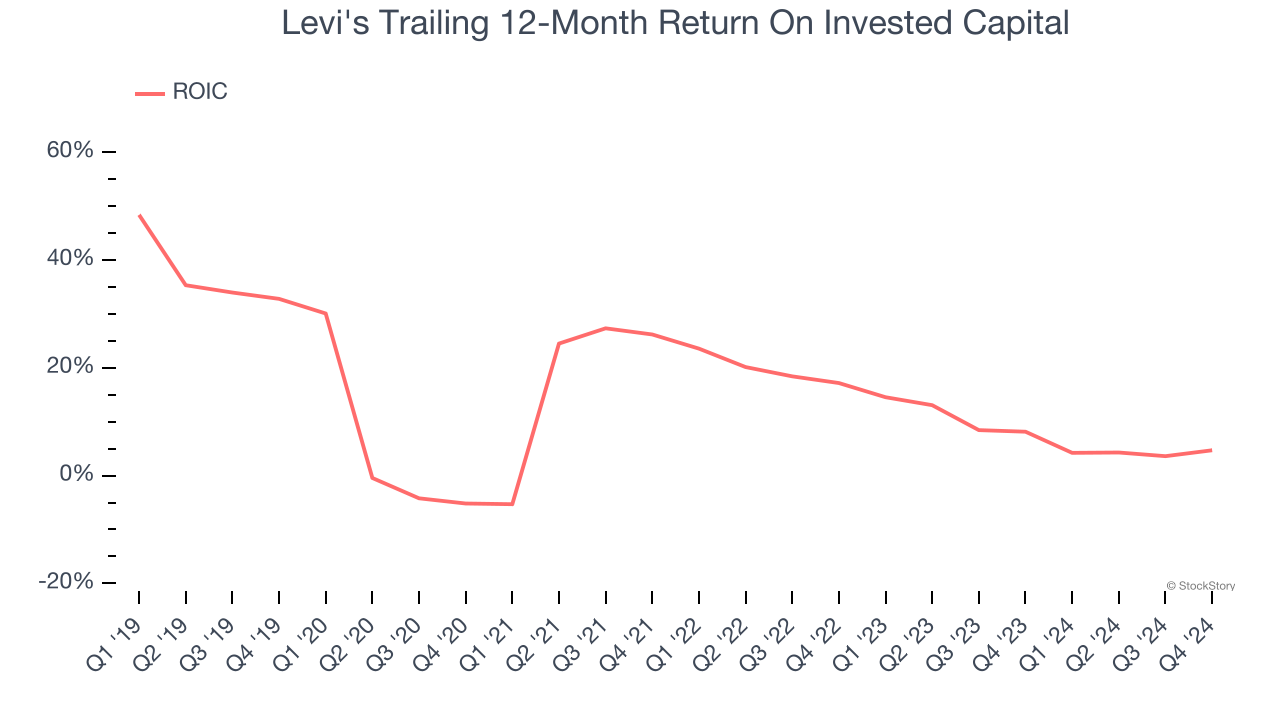
3. New Investments Fail to Bear Fruit as ROIC Declines
ROIC, or return on invested capital, is a metric showing how much operating profit a company generates relative to the money it has raised (debt and equity).
We like to invest in businesses with high returns, but the trend in a company’s ROIC is what often surprises the market and moves the stock price. On average, Levi’s ROIC decreased by 4.1 percentage points annually over the last few years. Paired with its already low returns, these declines suggest its profitable growth opportunities are few and far between.
Final Judgment
Levi's falls short of our quality standards. After the recent drawdown, the stock trades at 11.6× forward price-to-earnings (or $16.01 per share). While this valuation is fair, the upside isn’t great compared to the potential downside. There are more exciting stocks to buy at the moment. Let us point you toward our favorite semiconductor picks and shovels play.
Stocks We Like More Than Levi's
The elections are now behind us. With rates dropping and inflation cooling, many analysts expect a breakout market - and we’re zeroing in on the stocks that could benefit immensely.
Take advantage of the rebound by checking out our Top 9 Market-Beating Stocks. This is a curated list of our High Quality stocks that have generated a market-beating return of 175% over the last five years.
Stocks that made our list in 2019 include now familiar names such as Nvidia (+2,183% between December 2019 and December 2024) as well as under-the-radar businesses like Sterling Infrastructure (+1,096% five-year return). Find your next big winner with StockStory today for free.


