![]()
Earnings results often indicate what direction a company will take in the months ahead. With Q4 behind us, let’s have a look at Arrow Electronics (NYSE: ARW) and its peers.
Engineered components and systems companies possess technical know-how in sometimes narrow areas such as metal forming or intelligent robotics. Lately, automation and connected equipment collecting analyzable data have been trending, creating new demand. On the other hand, like the broader industrials sector, engineered components and systems companies are at the whim of economic cycles. Consumer spending and interest rates, for example, can greatly impact the industrial production that drives demand for these companies’ offerings.
The 13 engineered components and systems stocks we track reported a satisfactory Q4. As a group, revenues were in line with analysts’ consensus estimates while next quarter’s revenue guidance was 0.5% below.
While some engineered components and systems stocks have fared somewhat better than others, they have collectively declined. On average, share prices are down 3.3% since the latest earnings results.
Arrow Electronics (NYSE: ARW)
Founded as a single retail store, Arrow Electronics (NYSE: ARW) provides electronic components and enterprise computing solutions to businesses globally.
Arrow Electronics reported revenues of $7.28 billion, down 7.2% year on year. This print exceeded analysts’ expectations by 3.2%. Overall, it was a very strong quarter for the company with an impressive beat of analysts’ EBITDA estimates.
The stock is down 5.4% since reporting and currently trades at $108.67.
Is now the time to buy Arrow Electronics? Access our full analysis of the earnings results here, it’s free.
Best Q4: ESCO (NYSE: ESE)
A developer of the communication systems used in the Batmobile of “The Dark Knight,” ESCO (NYSE: ESE) is a provider of engineered components for the aerospace, defense, and utility sectors.
ESCO reported revenues of $247 million, up 13.2% year on year, outperforming analysts’ expectations by 2.8%. The business had a stunning quarter with EPS guidance for next quarter exceeding analysts’ expectations and a solid beat of analysts’ EPS estimates.
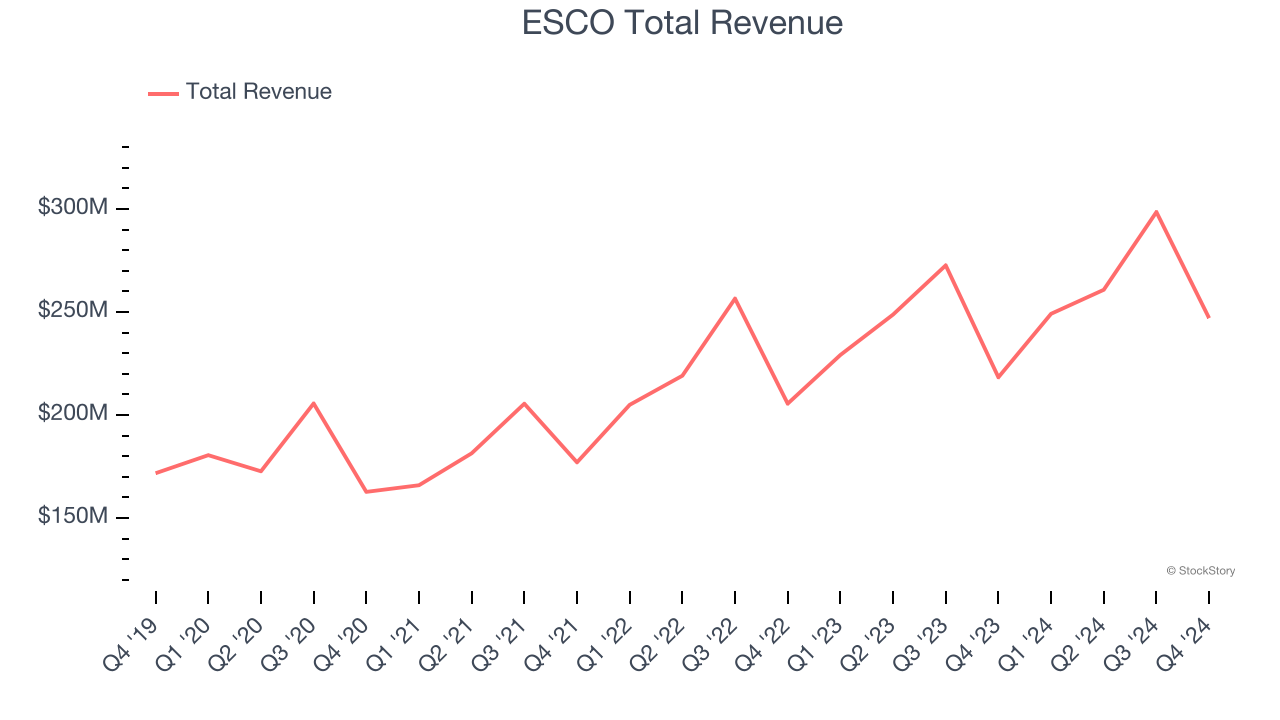
ESCO achieved the fastest revenue growth among its peers. The market seems happy with the results as the stock is up 25% since reporting. It currently trades at $165.42.
Is now the time to buy ESCO? Access our full analysis of the earnings results here, it’s free.
Weakest Q4: Regal Rexnord (NYSE: RRX)
Headquartered in Milwaukee, Regal Rexnord (NYSE: RRX) provides power transmission and industrial automation products.
Regal Rexnord reported revenues of $1.46 billion, down 9.1% year on year, falling short of analysts’ expectations by 1.9%. It was a disappointing quarter as it posted full-year EPS guidance missing analysts’ expectations.
As expected, the stock is down 20.3% since the results and currently trades at $123.50.
Read our full analysis of Regal Rexnord’s results here.
Timken (NYSE: TKR)
Established after the founder noticed the difficulty freight wagons had making sharp turns, Timken (NYSE: TKR) is a provider of industrial parts used across various sectors.
Timken reported revenues of $1.07 billion, down 1.6% year on year. This print beat analysts’ expectations by 0.8%. It was a strong quarter as it also recorded a solid beat of analysts’ EBITDA estimates.
The stock is down 3% since reporting and currently trades at $76.64.
Read our full, actionable report on Timken here, it’s free.
Graham Corporation (NYSE: GHM)
Founded when its founder patented a unique design for a vacuum system used in the sugar refining process, Graham (NYSE: GHM) provides vacuum and heat transfer equipment for the energy, petrochemical, refining, and chemical sectors.
Graham Corporation reported revenues of $47.04 million, up 7.3% year on year. This result lagged analysts' expectations by 5%. More broadly, it was a mixed quarter as it also produced an impressive beat of analysts’ EPS estimates.
Graham Corporation had the weakest performance against analyst estimates and weakest full-year guidance update among its peers. The stock is down 30.5% since reporting and currently trades at $32.74.
Read our full, actionable report on Graham Corporation here, it’s free.
Want to invest in winners with rock-solid fundamentals? Check out our 9 Best Market-Beating Stocks and add them to your watchlist. These companies are poised for growth regardless of the political or macroeconomic climate.
Join Paid Stock Investor Research
Help us make StockStory more helpful to investors like yourself. Join our paid user research session and receive a $50 Amazon gift card for your opinions. Sign up here.