
What a brutal six months it’s been for Lamb Weston. The stock has dropped 20.1% and now trades at $53.13, rattling many shareholders. This was partly driven by its softer quarterly results and might have investors contemplating their next move.
Following the pullback, is now the time to buy LW? Find out in our full research report, it’s free.
Why Does Lamb Weston Spark Debate?
Best known for its Grown in Idaho brand, Lamb Weston (NYSE: LW) produces and distributes potato products such as frozen french fries and mashed potatoes.
Two Positive Attributes:
1. Elevated Demand Drives Higher Sales Volumes
Revenue growth can be broken down into changes in price and volume (the number of units sold). While both are important, volume is the lifeblood of a successful staples business as there’s a ceiling to what consumers will pay for everyday goods; they can always trade down to non-branded products if the branded versions are too expensive.
Lamb Weston’s average quarterly volume growth was a robust 8.4% over the last two years. This is good because meaningful volume growth is hard to come by in the stable consumer staples sector. 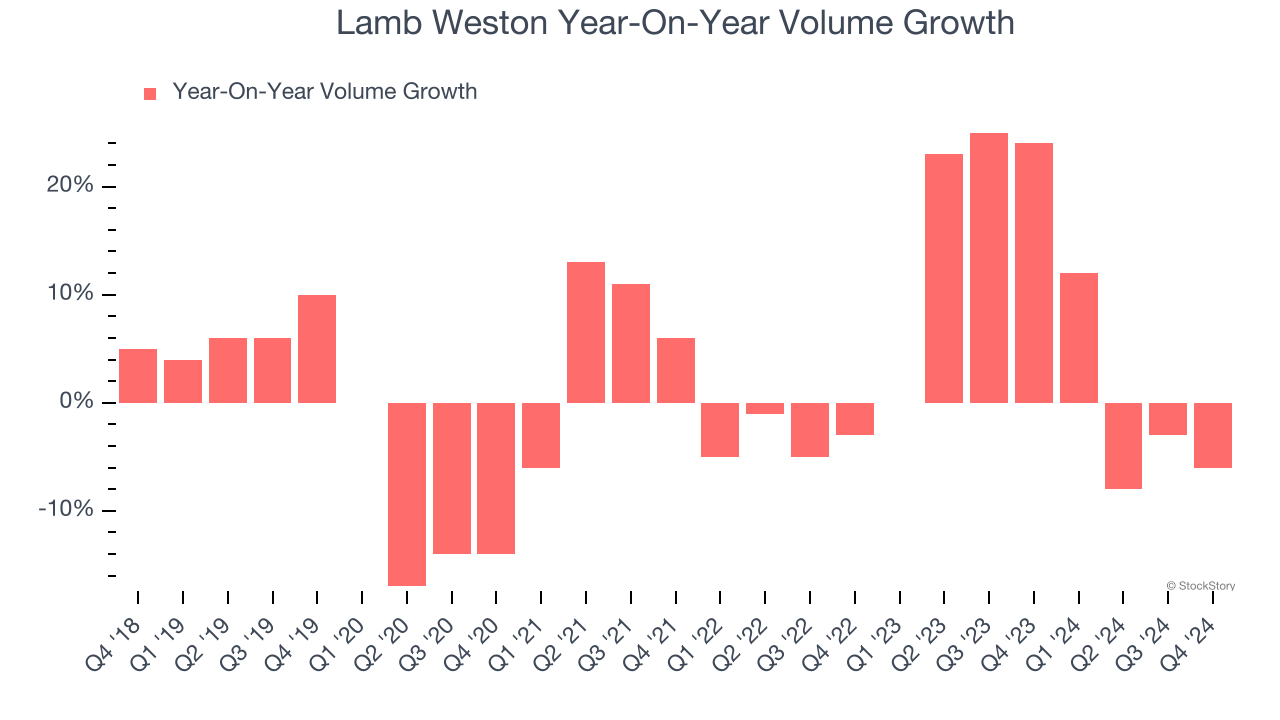
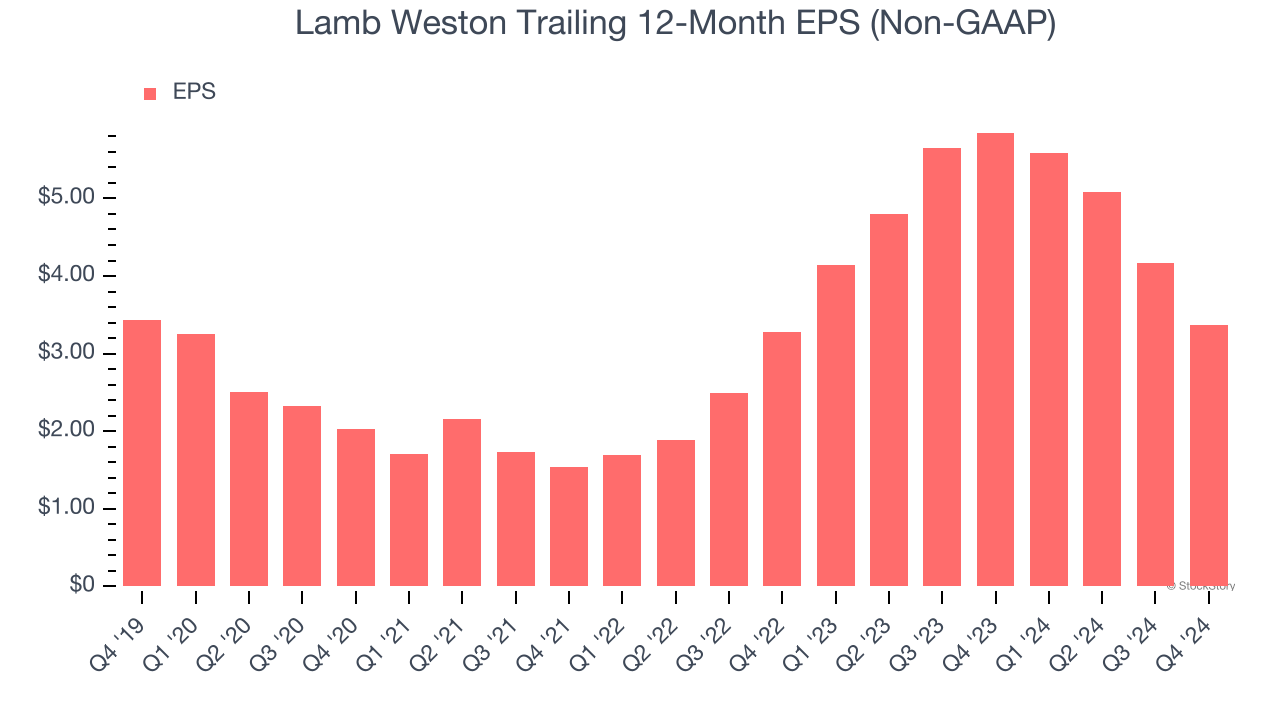
2. Outstanding Long-Term EPS Growth
We track the change in earnings per share (EPS) because it highlights whether a company’s growth is profitable.
Lamb Weston’s EPS grew at an astounding 29.9% compounded annual growth rate over the last three years, higher than its 17.5% annualized revenue growth. This tells us the company became more profitable on a per-share basis as it expanded.
One Reason to be Careful:
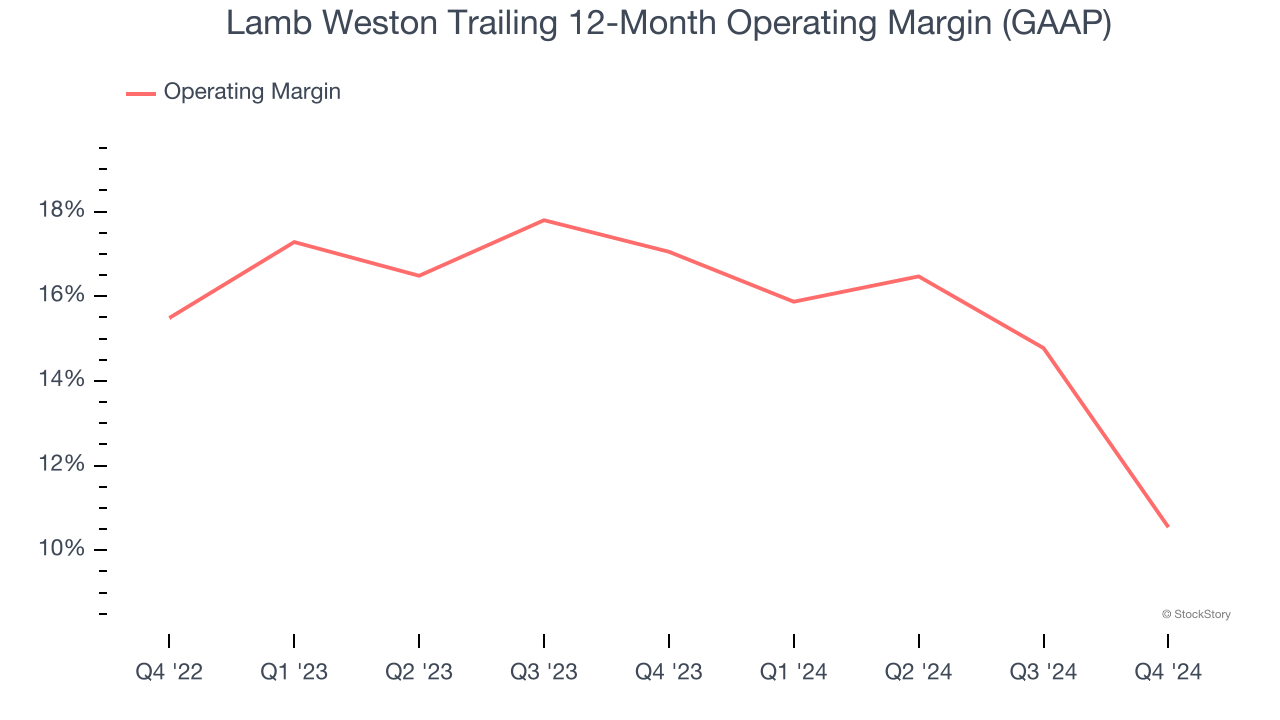
Shrinking Operating Margin
Operating margin is a key measure of profitability. Think of it as net income - the bottom line - excluding the impact of taxes and interest on debt, which are less connected to business fundamentals.
Looking at the trend in its profitability, Lamb Weston’s operating margin decreased by 6.5 percentage points over the last year. This raises questions about the company’s expense base because its revenue growth should have given it leverage on its fixed costs, resulting in better economies of scale and profitability. Its operating margin for the trailing 12 months was 10.5%.
Final Judgment
Lamb Weston’s positive characteristics outweigh the negatives. With the recent decline, the stock trades at 11× forward price-to-earnings (or $53.13 per share). Is now the right time to buy? See for yourself in our comprehensive research report, it’s free.
Stocks We Like Even More Than Lamb Weston
The elections are now behind us. With rates dropping and inflation cooling, many analysts expect a breakout market - and we’re zeroing in on the stocks that could benefit immensely.
Take advantage of the rebound by checking out our Top 5 Strong Momentum Stocks for this week. This is a curated list of our High Quality stocks that have generated a market-beating return of 175% over the last five years.
Stocks that made our list in 2019 include now familiar names such as Nvidia (+2,183% between December 2019 and December 2024) as well as under-the-radar businesses like Sterling Infrastructure (+1,096% five-year return). Find your next big winner with StockStory today for free.


