
Shareholders of Stanley Black & Decker would probably like to forget the past six months even happened. The stock dropped 28.7% and now trades at $78.23. This may have investors wondering how to approach the situation.
Is now the time to buy Stanley Black & Decker, or should you be careful about including it in your portfolio? See what our analysts have to say in our full research report, it’s free.
Even with the cheaper entry price, we're swiping left on Stanley Black & Decker for now. Here are three reasons why you should be careful with SWK and a stock we'd rather own.
Why Do We Think Stanley Black & Decker Will Underperform?
With an iconic “STANLEY” logo which has remained virtually unchanged for over a century, Stanley Black & Decker (NYSE: SWK) is a manufacturer primarily catering to the tool and outdoor equipment industry.
1. Core Business Falling Behind as Demand Declines
In addition to reported revenue, organic revenue is a useful data point for analyzing Professional Tools and Equipment companies. This metric gives visibility into Stanley Black & Decker’s core business because it excludes one-time events such as mergers, acquisitions, and divestitures along with foreign currency fluctuations - non-fundamental factors that can manipulate the income statement.
Over the last two years, Stanley Black & Decker’s organic revenue averaged 3% year-on-year declines. This performance was underwhelming and implies it may need to improve its products, pricing, or go-to-market strategy. It also suggests Stanley Black & Decker might have to lean into acquisitions to grow, which isn’t ideal because M&A can be expensive and risky (integrations often disrupt focus). 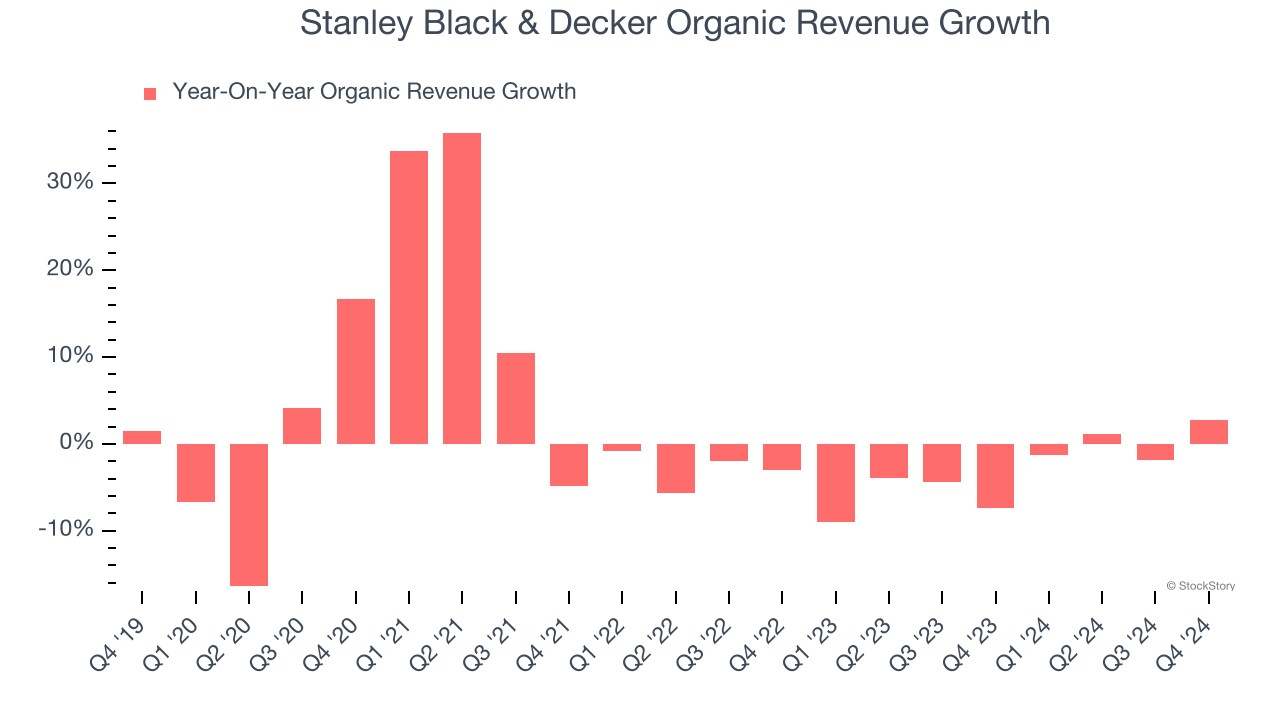
2. Free Cash Flow Margin Dropping
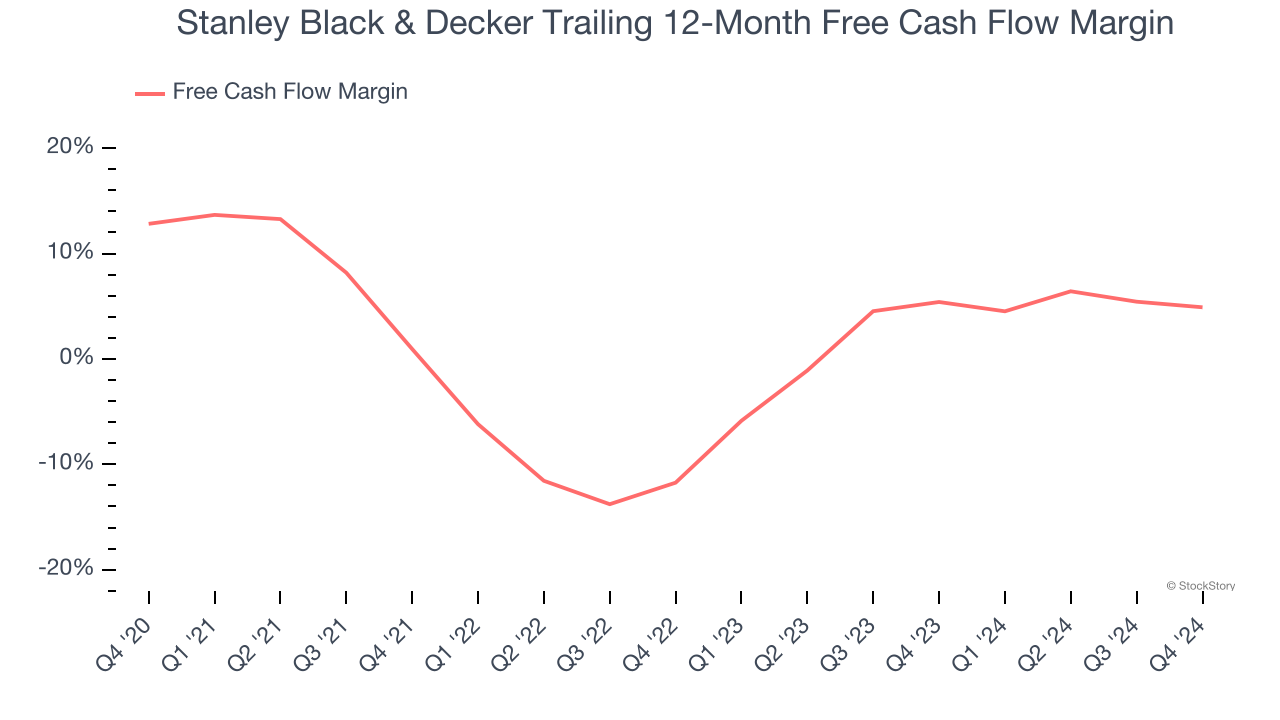
Free cash flow isn't a prominently featured metric in company financials and earnings releases, but we think it's telling because it accounts for all operating and capital expenses, making it tough to manipulate. Cash is king.
As you can see below, Stanley Black & Decker’s margin dropped by 7.9 percentage points over the last five years. Almost any movement in the wrong direction is undesirable because of its already low cash conversion. If the trend continues, it could signal it’s becoming a more capital-intensive business. Stanley Black & Decker’s free cash flow margin for the trailing 12 months was 4.9%.
3. New Investments Fail to Bear Fruit as ROIC Declines
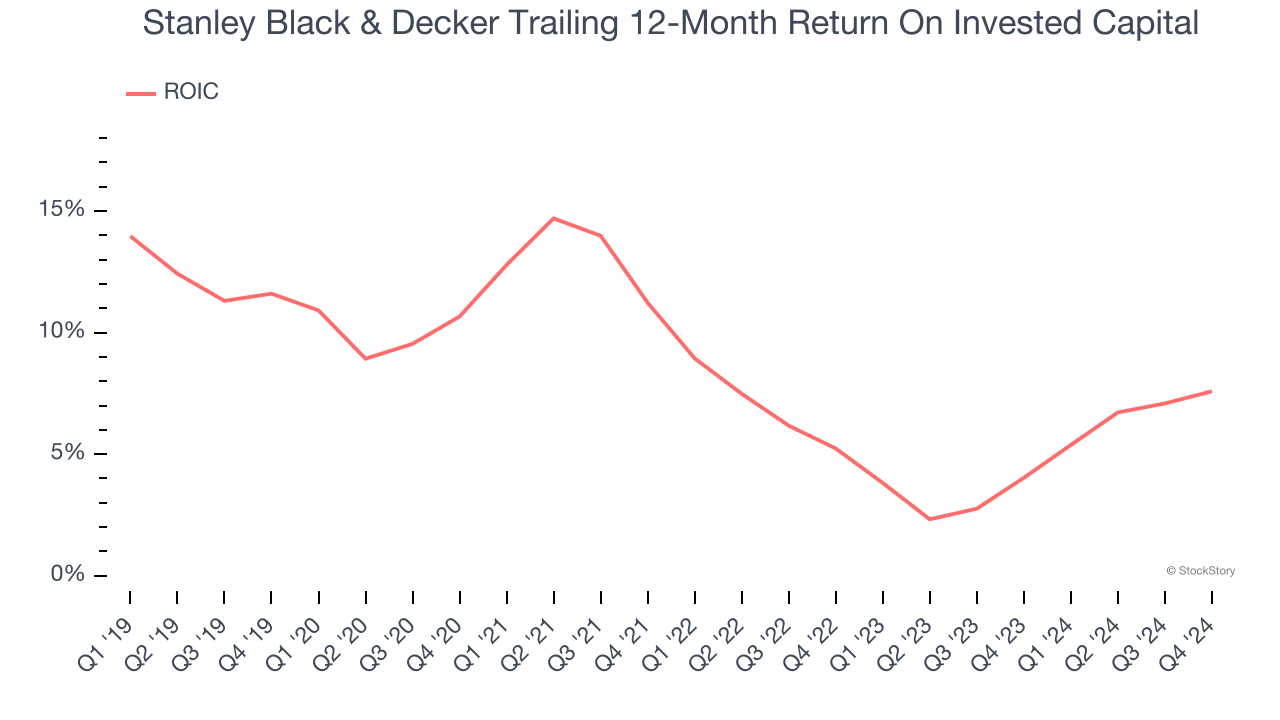
A company’s ROIC, or return on invested capital, shows how much operating profit it makes compared to the money it has raised (debt and equity).
We like to invest in businesses with high returns, but the trend in a company’s ROIC is what often surprises the market and moves the stock price. Unfortunately, Stanley Black & Decker’s ROIC has decreased over the last few years. Paired with its already low returns, these declines suggest its profitable growth opportunities are few and far between.
Final Judgment
Stanley Black & Decker falls short of our quality standards. After the recent drawdown, the stock trades at 15.2× forward price-to-earnings (or $78.23 per share). This multiple tells us a lot of good news is priced in - we think there are better opportunities elsewhere. We’d recommend looking at a dominant Aerospace business that has perfected its M&A strategy.
Stocks We Like More Than Stanley Black & Decker
The elections are now behind us. With rates dropping and inflation cooling, many analysts expect a breakout market - and we’re zeroing in on the stocks that could benefit immensely.
Take advantage of the rebound by checking out our Top 9 Market-Beating Stocks. This is a curated list of our High Quality stocks that have generated a market-beating return of 175% over the last five years.
Stocks that made our list in 2019 include now familiar names such as Nvidia (+2,183% between December 2019 and December 2024) as well as under-the-radar businesses like Comfort Systems (+751% five-year return). Find your next big winner with StockStory today for free.


