
Over the past six months, Douglas Dynamics’s stock price fell to $23.89. Shareholders have lost 13.4% of their capital, disappointing when considering the S&P 500 was flat. This may have investors wondering how to approach the situation.
Is there a buying opportunity in Douglas Dynamics, or does it present a risk to your portfolio? Get the full breakdown from our expert analysts, it’s free.
Even with the cheaper entry price, we're sitting this one out for now. Here are three reasons why PLOW doesn't excite us and a stock we'd rather own.
Why Do We Think Douglas Dynamics Will Underperform?
Once manufacturing snowplows designed for the iconic jeep vehicle precursor, Douglas Dynamics (NYSE: PLOW) offers snow and ice equipment for the roads and sidewalks.
1. Long-Term Revenue Growth Flatter Than a Pancake
A company’s long-term performance is an indicator of its overall quality. Any business can have short-term success, but a top-tier one grows for years. Unfortunately, Douglas Dynamics struggled to consistently increase demand as its $568.5 million of sales for the trailing 12 months was close to its revenue five years ago. This wasn’t a great result and is a sign of poor business quality. 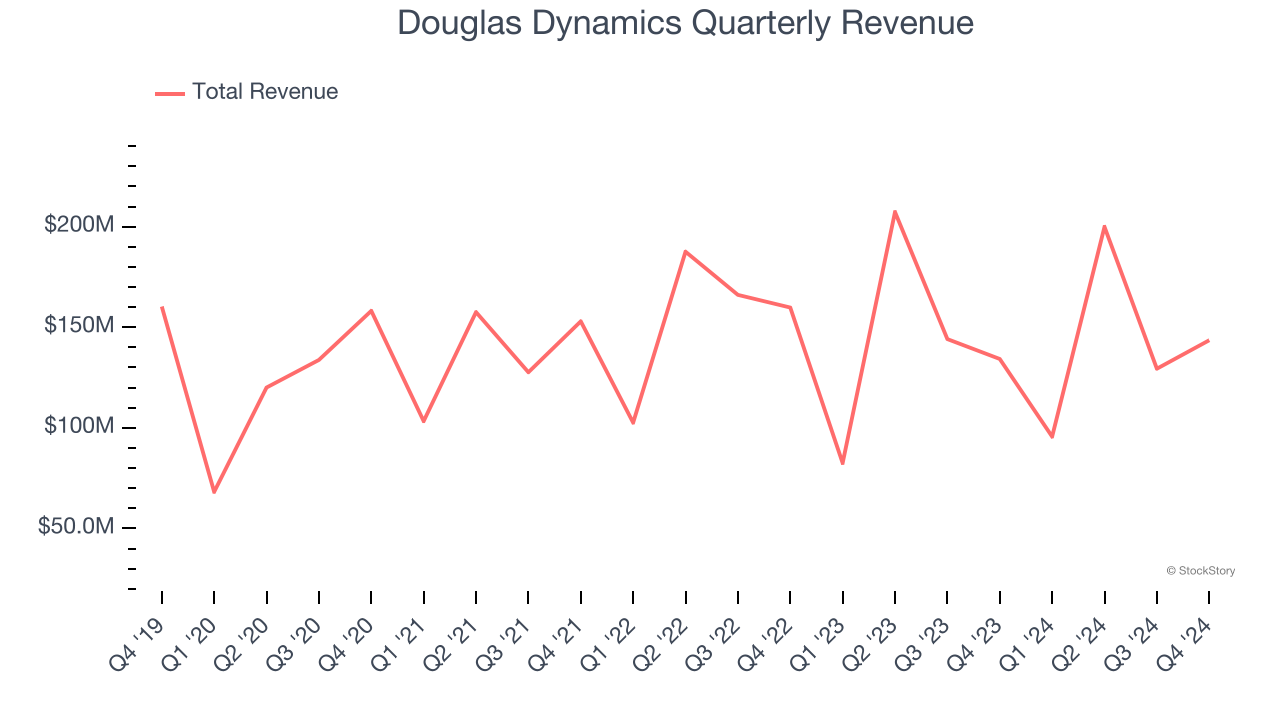
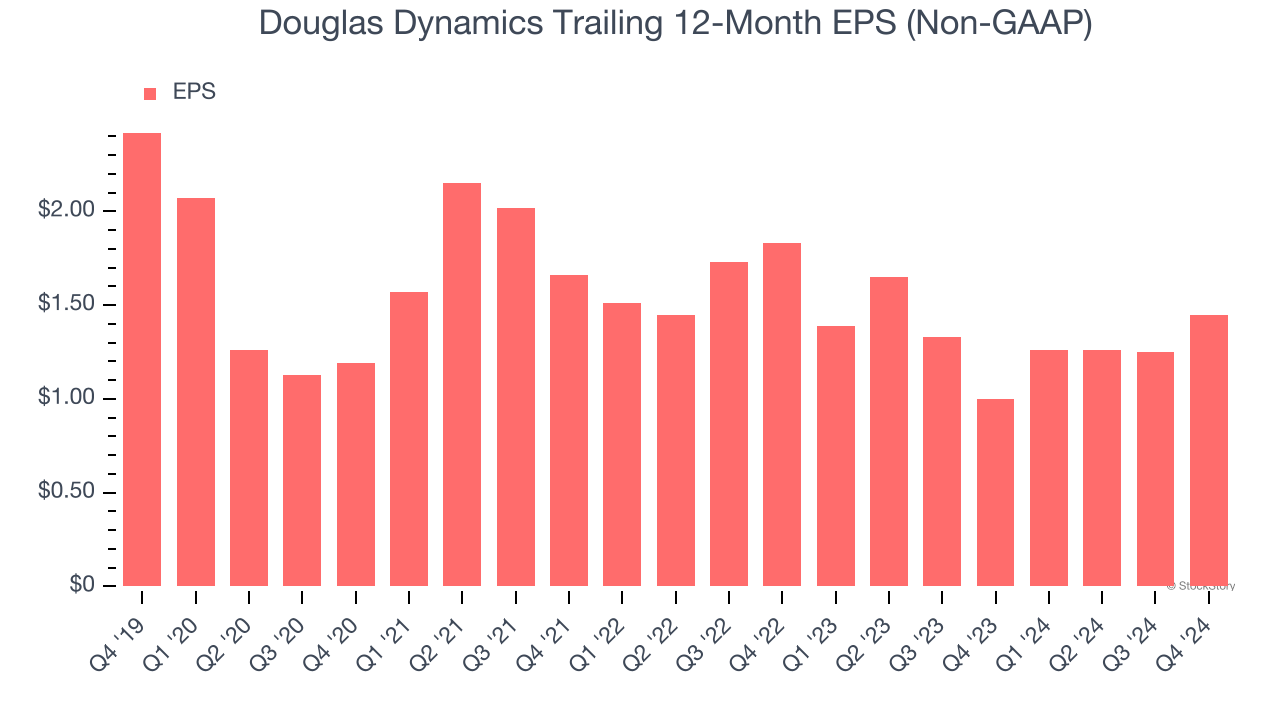
2. EPS Trending Down
We track the long-term change in earnings per share (EPS) because it highlights whether a company’s growth is profitable.
Sadly for Douglas Dynamics, its EPS declined by 9.7% annually over the last five years while its revenue was flat. This tells us the company struggled because its fixed cost base made it difficult to adjust to choppy demand.
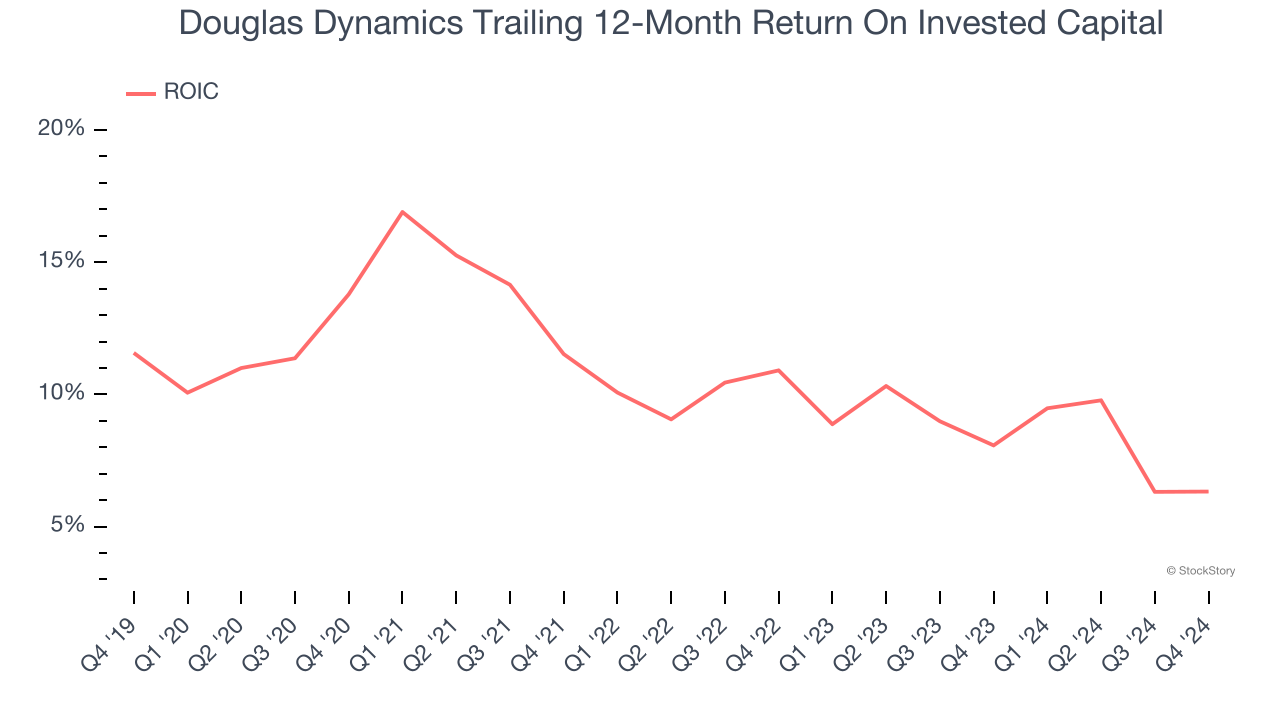
3. New Investments Fail to Bear Fruit as ROIC Declines
ROIC, or return on invested capital, is a metric showing how much operating profit a company generates relative to the money it has raised (debt and equity).
We like to invest in businesses with high returns, but the trend in a company’s ROIC is what often surprises the market and moves the stock price. Unfortunately, Douglas Dynamics’s ROIC has decreased over the last few years. We like what management has done in the past, but its declining returns are perhaps a symptom of fewer profitable growth opportunities.
Final Judgment
Douglas Dynamics doesn’t pass our quality test. After the recent drawdown, the stock trades at 13.3× forward price-to-earnings (or $23.89 per share). While this valuation is fair, the upside isn’t great compared to the potential downside. There are more exciting stocks to buy at the moment. We’d suggest looking at the most dominant software business in the world.
Stocks We Would Buy Instead of Douglas Dynamics
With rates dropping, inflation stabilizing, and the elections in the rearview mirror, all signs point to the start of a new bull run - and we’re laser-focused on finding the best stocks for this upcoming cycle.
Put yourself in the driver’s seat by checking out our Top 5 Growth Stocks for this month. This is a curated list of our High Quality stocks that have generated a market-beating return of 175% over the last five years.
Stocks that made our list in 2019 include now familiar names such as Nvidia (+2,183% between December 2019 and December 2024) as well as under-the-radar businesses like Comfort Systems (+751% five-year return). Find your next big winner with StockStory today for free.