Desktop Metal has been treading water for the past six months, recording a small return of 1.9% while holding steady at $4.76.
Is there a buying opportunity in Desktop Metal, or does it present a risk to your portfolio? Get the full stock story straight from our expert analysts, it’s free.
We're cautious about Desktop Metal. Here are three reasons why we avoid DM and a stock we'd rather own.
Why Is Desktop Metal Not Exciting?
Originating from a research lab at MIT, Desktop Metal (NYSE: DM) offers 3D printers, production materials, and software to many industries.
1. Revenue Tumbling Downwards
Long-term growth is the most important, but within industrials, a stretched historical view may miss new industry trends or demand cycles. Desktop Metal’s recent performance marks a sharp pivot from its five-year trend as its revenue has shown annualized declines of 2.4% over the last two years. 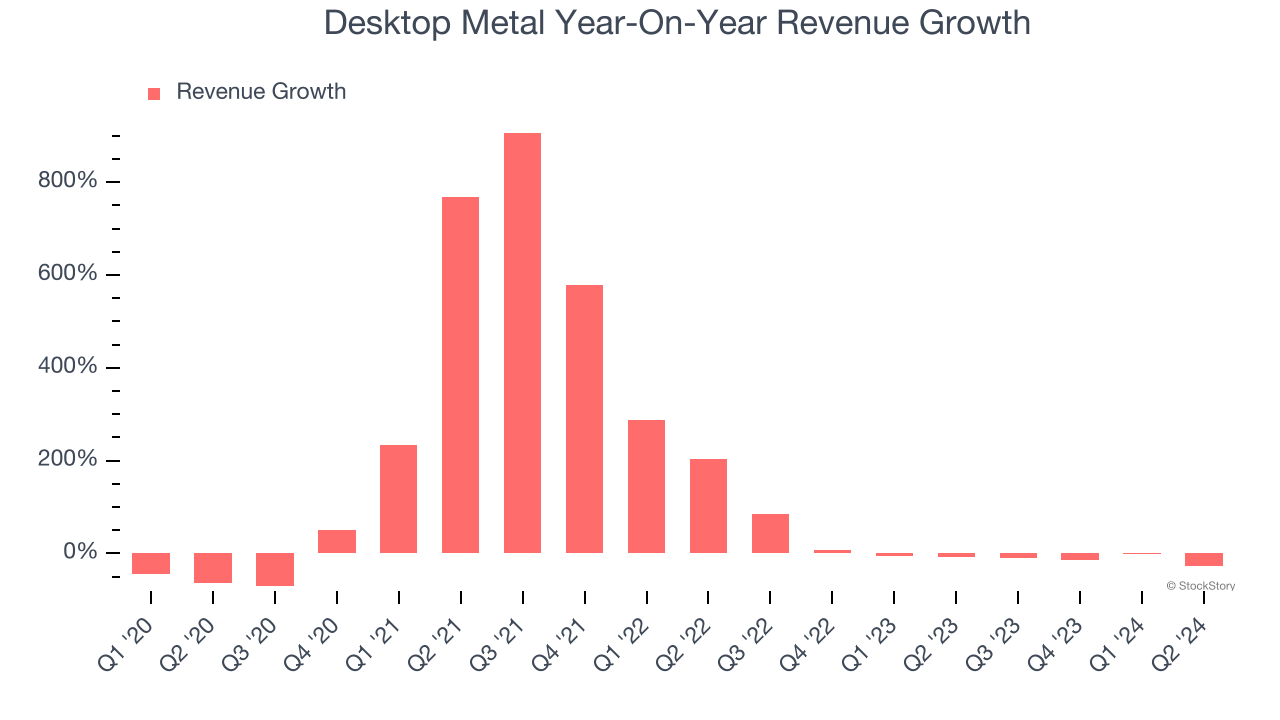
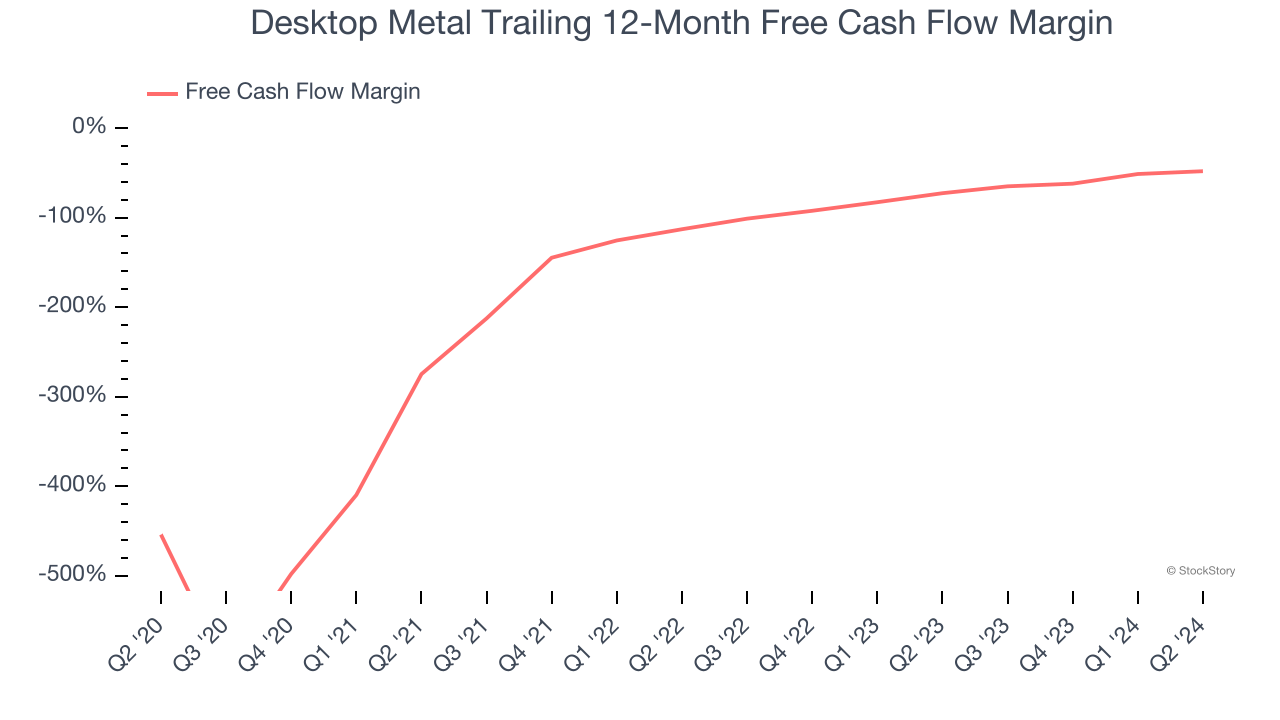
2. Cash Burn Ignites Concerns
If you’ve followed StockStory for a while, you know we emphasize free cash flow. Why, you ask? We believe that in the end, cash is king, and you can’t use accounting profits to pay the bills.
Desktop Metal’s demanding reinvestments have drained its resources over the last five years, putting it in a pinch and limiting its ability to return capital to investors. Its free cash flow margin averaged negative 103%, meaning it lit $103.30 of cash on fire for every $100 in revenue.
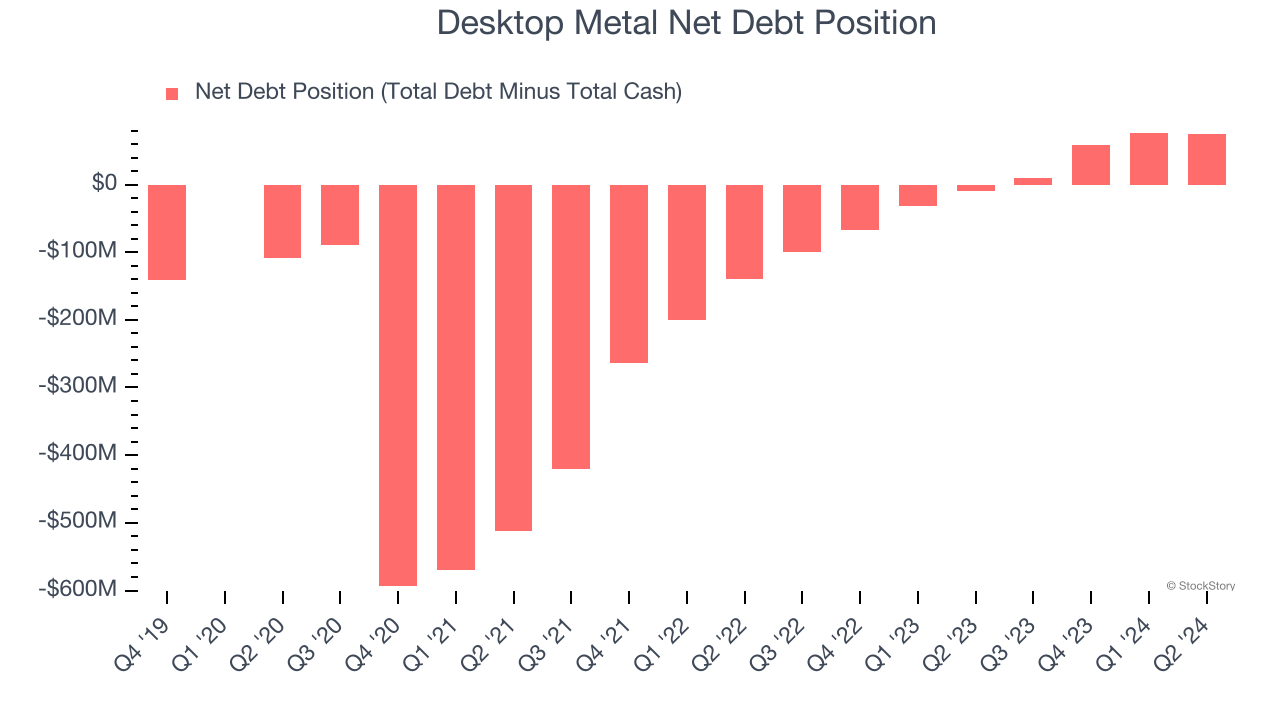
3. Short Cash Runway Exposes Shareholders to Potential Dilution
As long-term investors, the risk we care about most is the permanent loss of capital, which can happen when a company goes bankrupt or raises money from a disadvantaged position. This is separate from short-term stock price volatility, something we are much less bothered by.
Desktop Metal burned through $84.07 million of cash over the last year, and its $120.7 million of debt exceeds the $46.03 million of cash on its balance sheet. This is a deal breaker for us because indebted loss-making companies spell trouble.
Unless the Desktop Metal’s fundamentals change quickly, it might find itself in a position where it must raise capital from investors to continue operating. Whether that would be favorable is unclear because dilution is a headwind for shareholder returns.
We remain cautious of Desktop Metal until it generates consistent free cash flow or any of its announced financing plans materialize on its balance sheet.
Final Judgment
Desktop Metal isn’t a terrible business, but it doesn’t pass our bar. That said, the stock currently trades at $4.76 per share (or 0.8× forward price-to-sales). The market typically values companies like Desktop Metal based on their anticipated profits for the next 12 months, but it expects the business to lose money. We also think the upside isn’t great compared to the potential downside here - there are more exciting stocks to buy. We’d recommend looking at the Amazon and PayPal of Latin America.
Stocks We Would Buy Instead of Desktop Metal
With rates dropping, inflation stabilizing, and the elections in the rearview mirror, all signs point to the start of a new bull run - and we’re laser-focused on finding the best stocks for this upcoming cycle.
Put yourself in the driver’s seat by checking out our Top 9 Market-Beating Stocks. This is a curated list of our High Quality stocks that have generated a market-beating return of 175% over the last five years.
Stocks that made our list in 2019 include now familiar names such as Nvidia (+2,183% between December 2019 and December 2024) as well as under-the-radar businesses like Comfort Systems (+751% five-year return). Find your next big winner with StockStory today for free.