Dayforce trades at $58.01 per share and has stayed right on track with the overall market, losing 5.3% over the last six months while the S&P 500 is down 4.1%. This was partly driven by its softer quarterly results and may have investors wondering how to approach the situation.
Is now the time to buy Dayforce, or should you be careful about including it in your portfolio? Check out our in-depth research report to see what our analysts have to say, it’s free.
Even though the stock has become cheaper, we're swiping left on Dayforce for now. Here are three reasons why DAY doesn't excite us and a stock we'd rather own.
Why Is Dayforce Not Exciting?
Founded in 1992 as Ceridian, an outsourced payroll processor and transformed after the 2012 acquisition of Dayforce, Dayforce (NYSE: DAY) is a provider of cloud based payroll and HR software targeted at mid-sized businesses.
1. Long-Term Revenue Growth Disappoints
Examining a company’s long-term performance can provide clues about its quality. Any business can put up a good quarter or two, but many enduring ones grow for years. Over the last three years, Dayforce grew its sales at a 19.8% compounded annual growth rate. Although this growth is acceptable on an absolute basis, it fell slightly short of our standards for the software sector, which enjoys a number of secular tailwinds. 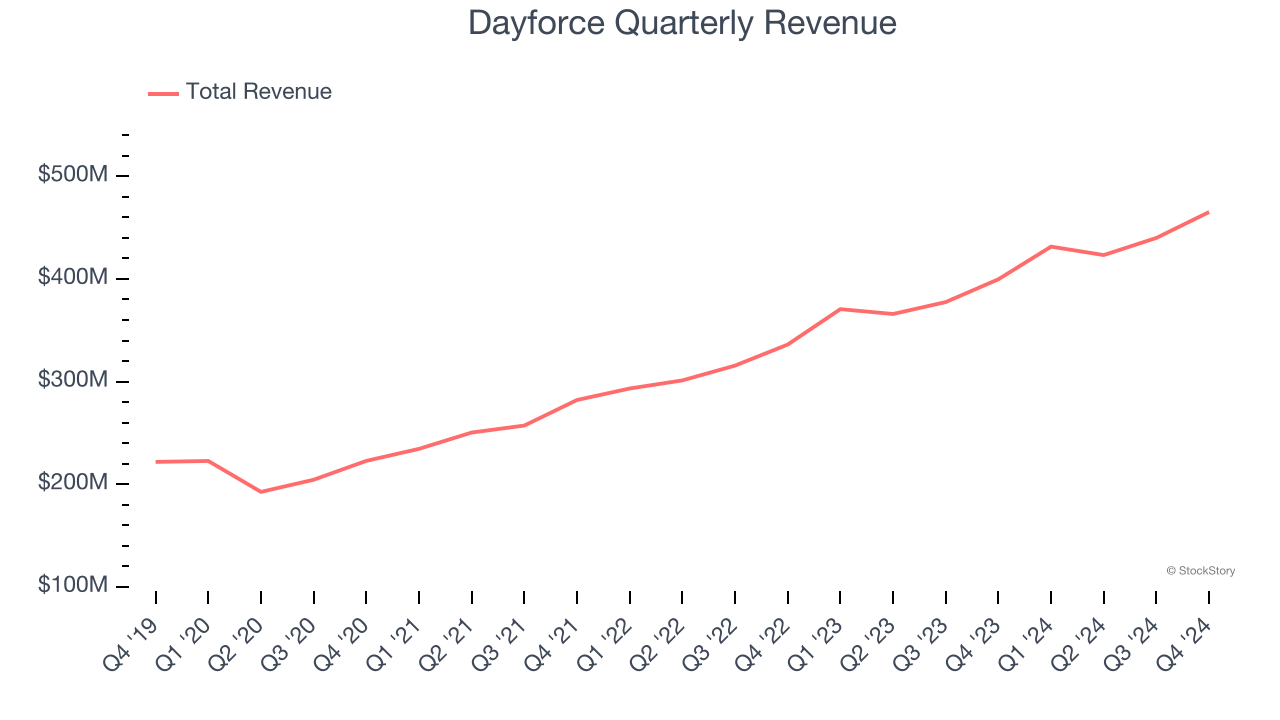
2. Low Gross Margin Reveals Weak Structural Profitability
For software companies like Dayforce, gross profit tells us how much money remains after paying for the base cost of products and services (typically servers, licenses, and certain personnel). These costs are usually low as a percentage of revenue, explaining why software is more lucrative than other sectors.
Dayforce’s gross margin is substantially worse than most software businesses, signaling it has relatively high infrastructure costs compared to asset-lite businesses like ServiceNow. As you can see below, it averaged a 50.7% gross margin over the last year. Said differently, Dayforce had to pay a chunky $49.29 to its service providers for every $100 in revenue. 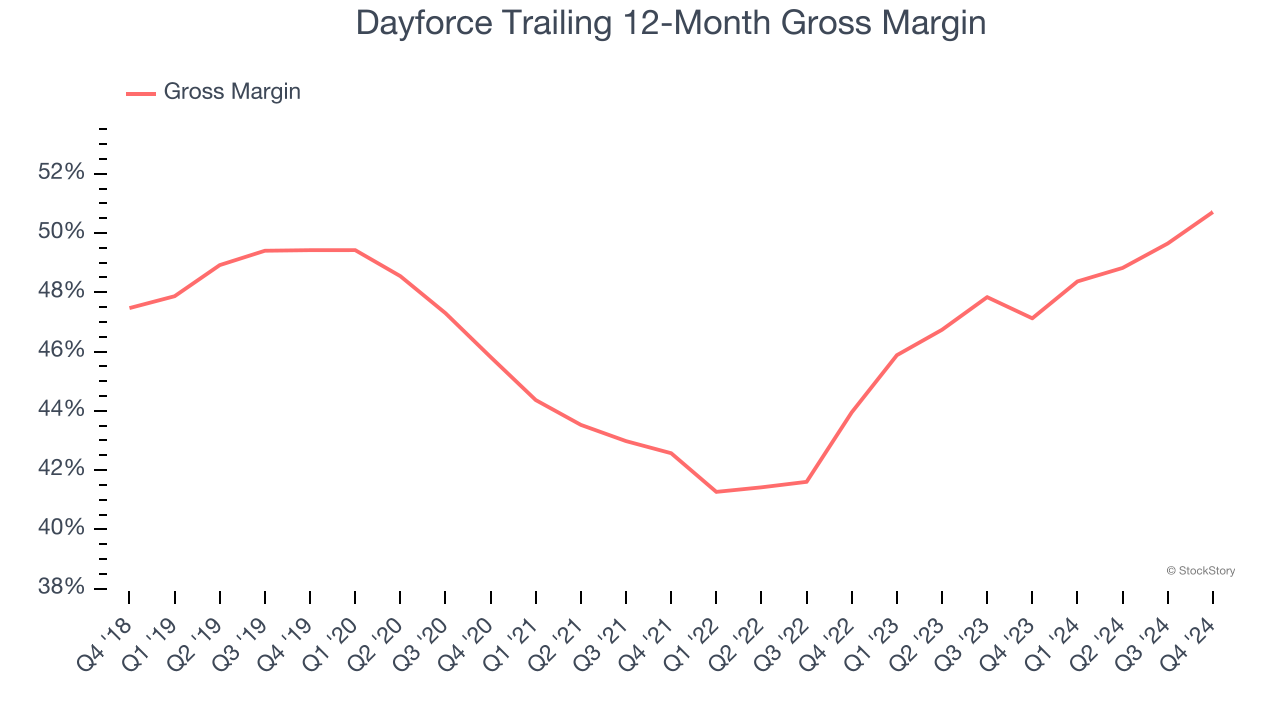
3. Shrinking Operating Margin
Many software businesses adjust their profits for stock-based compensation (SBC), but we prioritize GAAP operating margin because SBC is a real expense used to attract and retain engineering and sales talent. This is one of the best measures of profitability because it shows how much money a company takes home after developing, marketing, and selling its products.
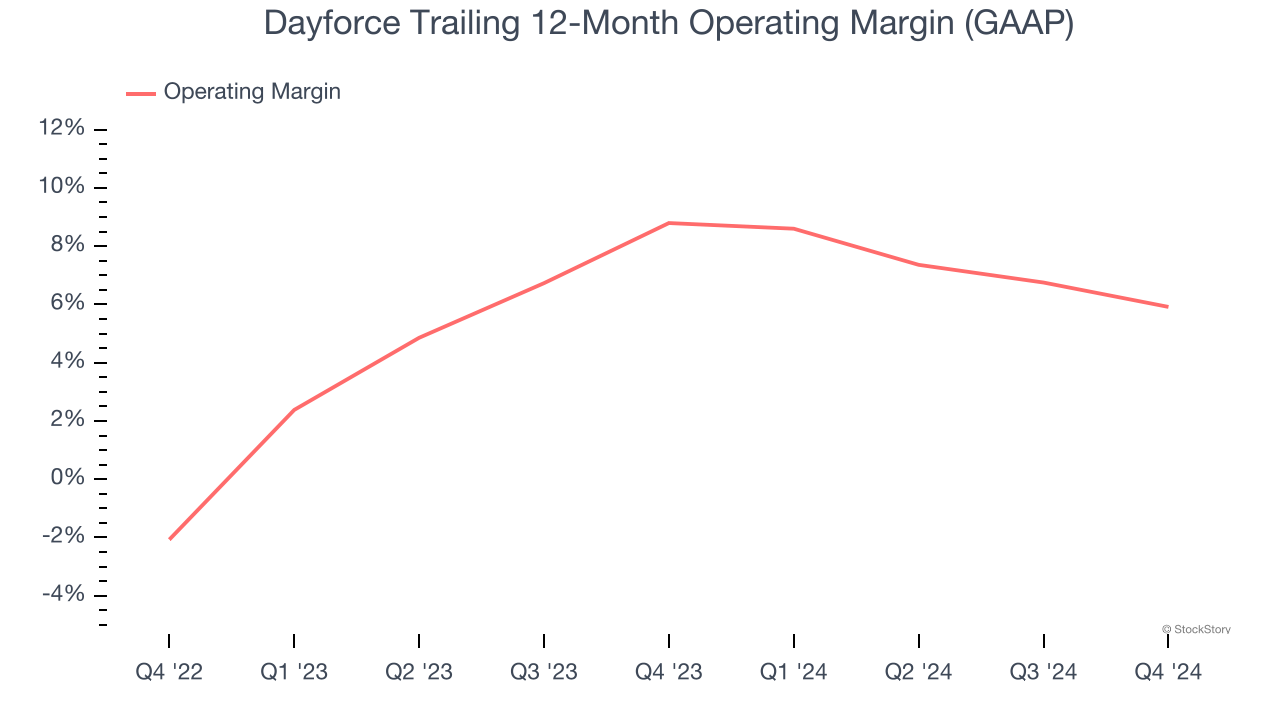
Analyzing the trend in its profitability, Dayforce’s operating margin decreased by 2.9 percentage points over the last year. This raises questions about the company’s expense base because its revenue growth should have given it leverage on its fixed costs, resulting in better economies of scale and profitability. Its operating margin for the trailing 12 months was 5.9%.
Final Judgment
Dayforce isn’t a terrible business, but it doesn’t pass our bar. After the recent drawdown, the stock trades at 4.9× forward price-to-sales (or $58.01 per share). Investors with a higher risk tolerance might like the company, but we think the potential downside is too great. We're pretty confident there are superior stocks to buy right now. Let us point you toward the most entrenched endpoint security platform on the market.
Stocks We Like More Than Dayforce
The elections are now behind us. With rates dropping and inflation cooling, many analysts expect a breakout market - and we’re zeroing in on the stocks that could benefit immensely.
Take advantage of the rebound by checking out our Top 9 Market-Beating Stocks. This is a curated list of our High Quality stocks that have generated a market-beating return of 175% over the last five years.
Stocks that made our list in 2019 include now familiar names such as Nvidia (+2,183% between December 2019 and December 2024) as well as under-the-radar businesses like Comfort Systems (+751% five-year return). Find your next big winner with StockStory today for free.