
Aerospace and defense technology solutions provider Astronics Corporation (NASDAQ: ATRO) announced better-than-expected revenue in Q4 CY2024, with sales up 6.8% year on year to $208.5 million. Guidance for next quarter’s revenue was better than expected at $197.5 million at the midpoint, 2% above analysts’ estimates. Its GAAP loss of $0.08 per share was significantly below analysts’ consensus estimates.
Is now the time to buy Astronics? Find out by accessing our full research report, it’s free.
Astronics (ATRO) Q4 CY2024 Highlights:
- Revenue: $208.5 million vs analyst estimates of $194.9 million (6.8% year-on-year growth, 7% beat)
- EPS (GAAP): -$0.08 vs analyst estimates of $0.17 (significant miss)
- Adjusted EBITDA: $31.54 million vs analyst estimates of $25.36 million (15.1% margin, 24.4% beat)
- Management’s revenue guidance for the upcoming financial year 2025 is $840 million at the midpoint, in line with analyst expectations and implying 5.6% growth (vs 15.9% in FY2024)
- Operating Margin: 4.3%, in line with the same quarter last year
- Free Cash Flow was $23.23 million, up from -$3.28 million in the same quarter last year
- Backlog: $599.2 million at quarter end
- Market Capitalization: $694.6 million
Company Overview
Integrating power outlets into many Boeing aircraft, Astronics (NASDAQ: ATRO) is a provider of technologies and services to the global aerospace, defense, and electronics industries.
Aerospace
Aerospace companies often possess technical expertise and have made significant capital investments to produce complex products. It is an industry where innovation is important, and lately, emissions and automation are in focus, so companies that boast advances in these areas can take market share. On the other hand, demand for aerospace products can ebb and flow with economic cycles and geopolitical tensions, which can be particularly painful for companies with high fixed costs.
Sales Growth
A company’s long-term sales performance can indicate its overall quality. Any business can put up a good quarter or two, but many enduring ones grow for years. Unfortunately, Astronics struggled to consistently increase demand as its $795.4 million of sales for the trailing 12 months was close to its revenue five years ago. This was below our standards and is a sign of lacking business quality.
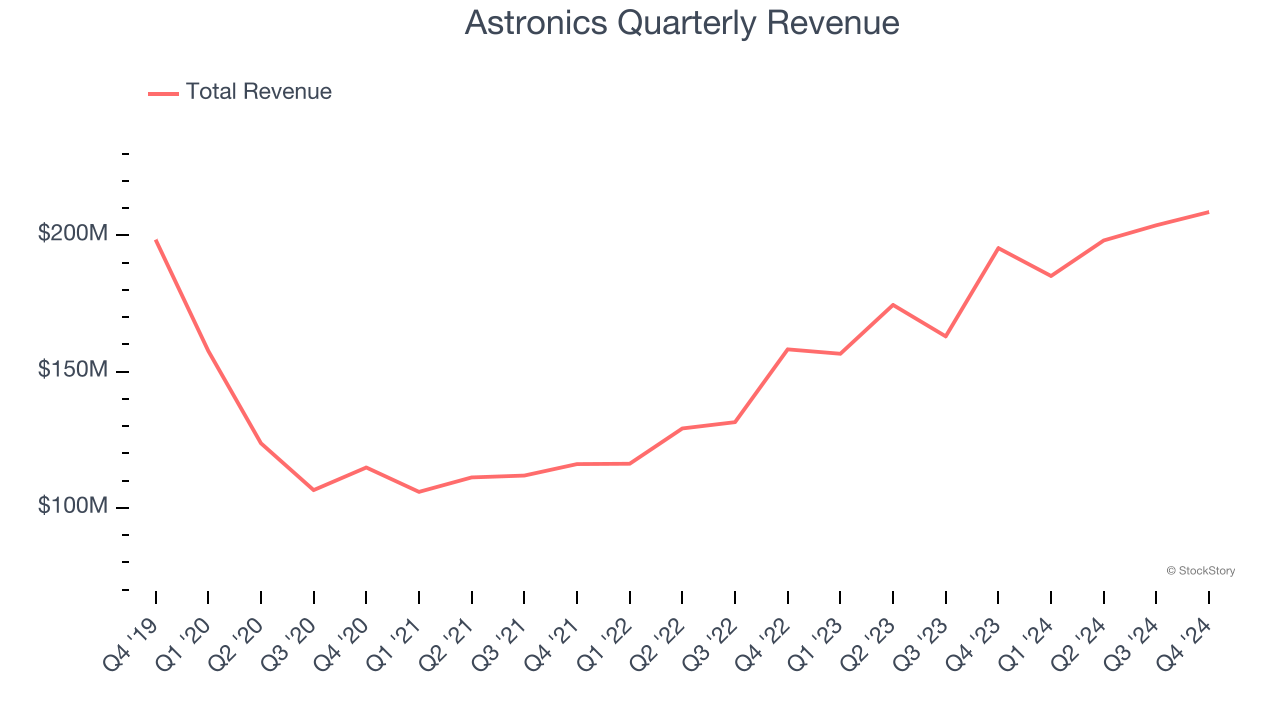
Long-term growth is the most important, but within industrials, a half-decade historical view may miss new industry trends or demand cycles. Astronics’s annualized revenue growth of 21.9% over the last two years is above its five-year trend, suggesting its demand recently accelerated. 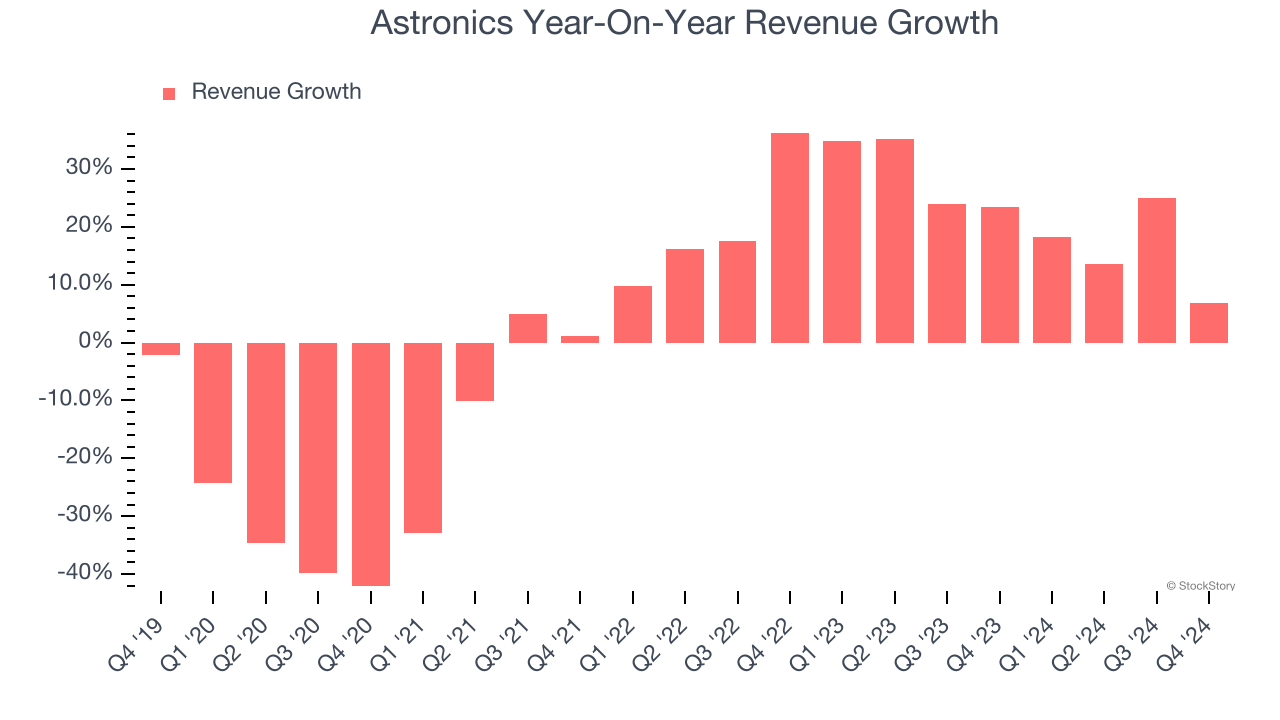
This quarter, Astronics reported year-on-year revenue growth of 6.8%, and its $208.5 million of revenue exceeded Wall Street’s estimates by 7%. Company management is currently guiding for a 6.7% year-on-year increase in sales next quarter.
Looking further ahead, sell-side analysts expect revenue to grow 4.5% over the next 12 months, a deceleration versus the last two years. This projection is underwhelming and suggests its products and services will face some demand challenges.
Today’s young investors won’t have read the timeless lessons in Gorilla Game: Picking Winners In High Technology because it was written more than 20 years ago when Microsoft and Apple were first establishing their supremacy. But if we apply the same principles, then enterprise software stocks leveraging their own generative AI capabilities may well be the Gorillas of the future. So, in that spirit, we are excited to present our Special Free Report on a profitable, fast-growing enterprise software stock that is already riding the automation wave and looking to catch the generative AI next.
Operating Margin
Although Astronics was profitable this quarter from an operational perspective, it’s generally struggled over a longer time period. Its expensive cost structure has contributed to an average operating margin of negative 2.6% over the last five years. Unprofitable industrials companies require extra attention because they could get caught swimming naked when the tide goes out. It’s hard to trust that the business can endure a full cycle.
On the plus side, Astronics’s operating margin rose by 5.9 percentage points over the last five years. Still, it will take much more for the company to show consistent profitability.
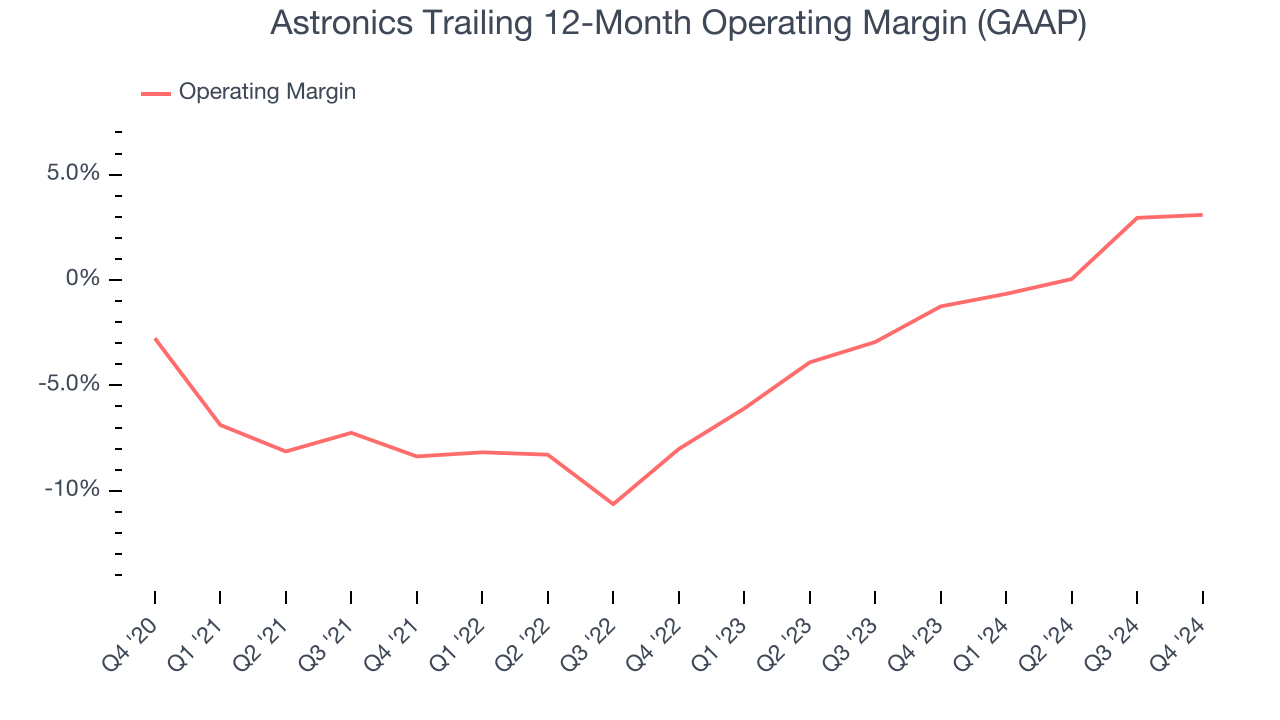
This quarter, Astronics generated an operating profit margin of 4.3%, in line with the same quarter last year. This indicates the company’s overall cost structure has been relatively stable.
Earnings Per Share
Revenue trends explain a company’s historical growth, but the long-term change in earnings per share (EPS) points to the profitability of that growth – for example, a company could inflate its sales through excessive spending on advertising and promotions.
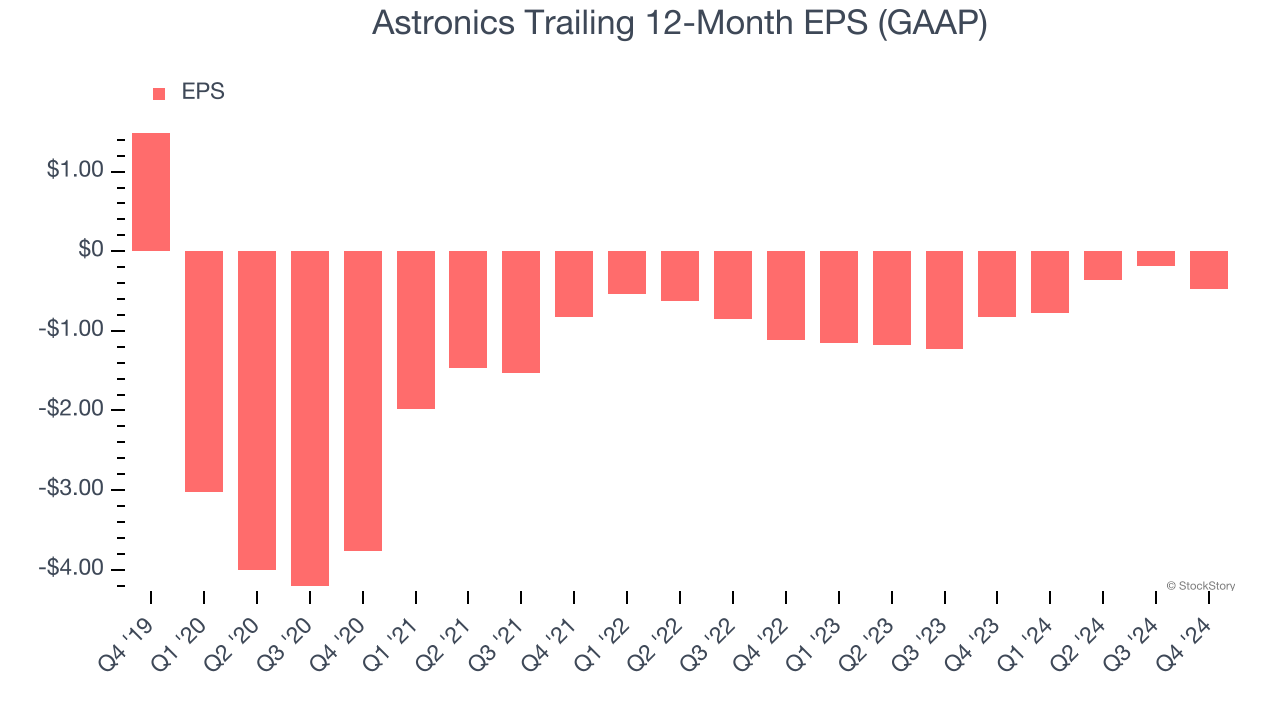
Sadly for Astronics, its EPS declined by 18.3% annually over the last five years while its revenue was flat. However, its operating margin actually expanded during this time, telling us that non-fundamental factors such as interest and taxes affected its ultimate earnings.
We can take a deeper look into Astronics’s earnings to better understand the drivers of its performance. A five-year view shows Astronics has diluted its shareholders, growing its share count by 14%. This dilution overshadowed its increased operating efficiency and has led to lower per share earnings. Taxes and interest expenses can also affect EPS but don’t tell us as much about a company’s fundamentals. 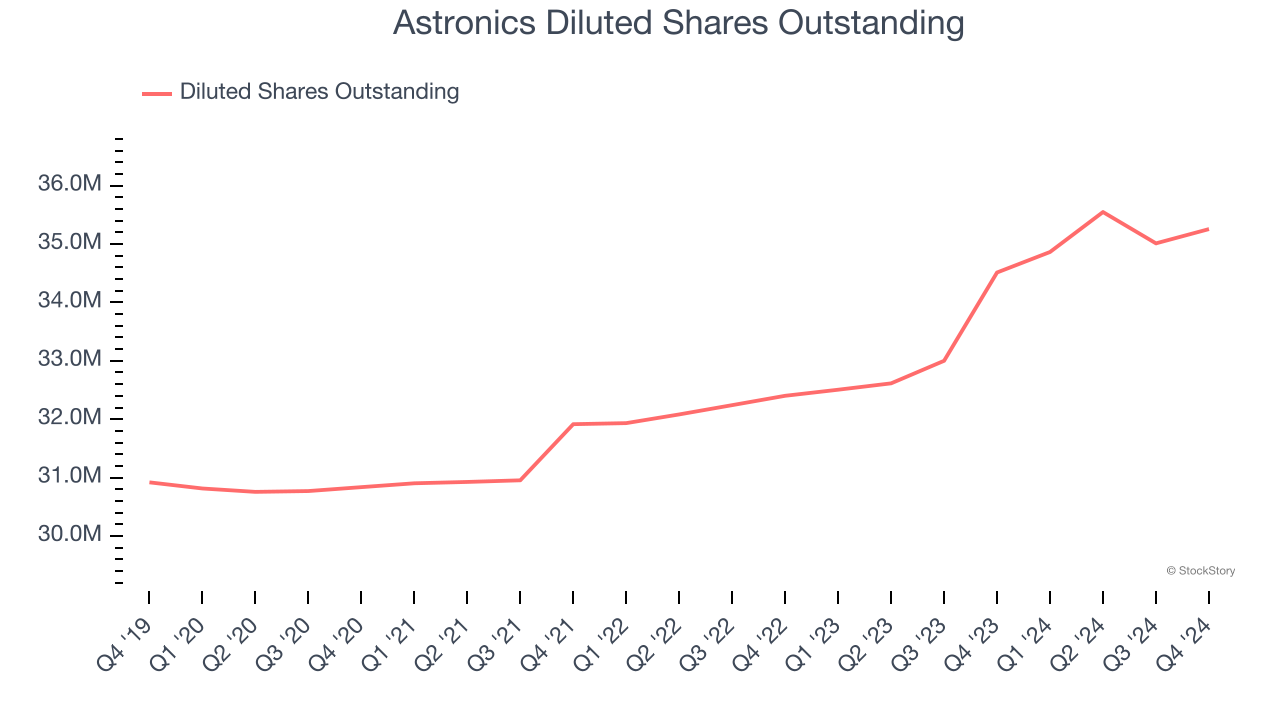
Like with revenue, we analyze EPS over a shorter period to see if we are missing a change in the business.
For Astronics, its two-year annual EPS growth of 34.9% was higher than its five-year trend. Its improving earnings is an encouraging data point, but a caveat is that its EPS is still in the red.
In Q4, Astronics reported EPS at negative $0.08, down from $0.20 in the same quarter last year. This print missed analysts’ estimates. Over the next 12 months, Wall Street is optimistic. Analysts forecast Astronics’s full-year EPS of negative $0.47 will flip to positive $0.97.
Key Takeaways from Astronics’s Q4 Results
We were impressed by how significantly Astronics blew past analysts’ EBITDA expectations this quarter. We were also excited its revenue outperformed Wall Street’s estimates by a wide margin. One thing to note is that its EPS missed due to a non-recurring $3 million loss on the extinguishment of some debt. Overall, this quarter had some key positives. The stock traded up 9.6% to $21.90 immediately after reporting.
Astronics may have had a good quarter, but does that mean you should invest right now? If you’re making that decision, you should consider the bigger picture of valuation, business qualities, as well as the latest earnings. We cover that in our actionable full research report which you can read here, it’s free.


