Vertically integrated manufacturing solutions provider Mayville Engineering Company (NYSE: MEC) missed Wall Street’s revenue expectations in Q4 CY2024, with sales falling 18.4% year on year to $121.3 million. The company’s full-year revenue guidance of $575 million at the midpoint came in 4.8% below analysts’ estimates. Its non-GAAP loss of $0.07 per share was 13.2% above analysts’ consensus estimates.
Is now the time to buy Mayville Engineering? Find out by accessing our full research report, it’s free.
Mayville Engineering (MEC) Q4 CY2024 Highlights:
- Revenue: $121.3 million vs analyst estimates of $124.1 million (18.4% year-on-year decline, 2.3% miss)
- Adjusted EPS: -$0.07 vs analyst estimates of -$0.08 (13.2% beat)
- Adjusted EBITDA: $9.19 million vs analyst estimates of $9.30 million (7.6% margin, 1.2% miss)
- Management’s revenue guidance for the upcoming financial year 2025 is $575 million at the midpoint, missing analyst estimates by 4.8% and implying -1.1% growth (vs -0.5% in FY2024)
- EBITDA guidance for the upcoming financial year 2025 is $63 million at the midpoint, below analyst estimates of $69.82 million
- Operating Margin: 19%, up from 3.6% in the same quarter last year
- Free Cash Flow Margin: 29.4%, up from 13.4% in the same quarter last year
- Market Capitalization: $287 million
Company Overview
Originally founded solely on tool and die manufacturing, Mayville Engineering Company (NYSE: MEC) specializes in metal fabrication, tube bending, and welding to be used in various industries.
Engineered Components and Systems
Engineered components and systems companies possess technical know-how in sometimes narrow areas such as metal forming or intelligent robotics. Lately, automation and connected equipment collecting analyzable data have been trending, creating new demand. On the other hand, like the broader industrials sector, engineered components and systems companies are at the whim of economic cycles. Consumer spending and interest rates, for example, can greatly impact the industrial production that drives demand for these companies’ offerings.
Sales Growth
A company’s long-term performance is an indicator of its overall quality. While any business can experience short-term success, top-performing ones enjoy sustained growth for years. Regrettably, Mayville Engineering’s sales grew at a sluggish 2.3% compounded annual growth rate over the last five years. This fell short of our benchmarks and is a poor baseline for our analysis.
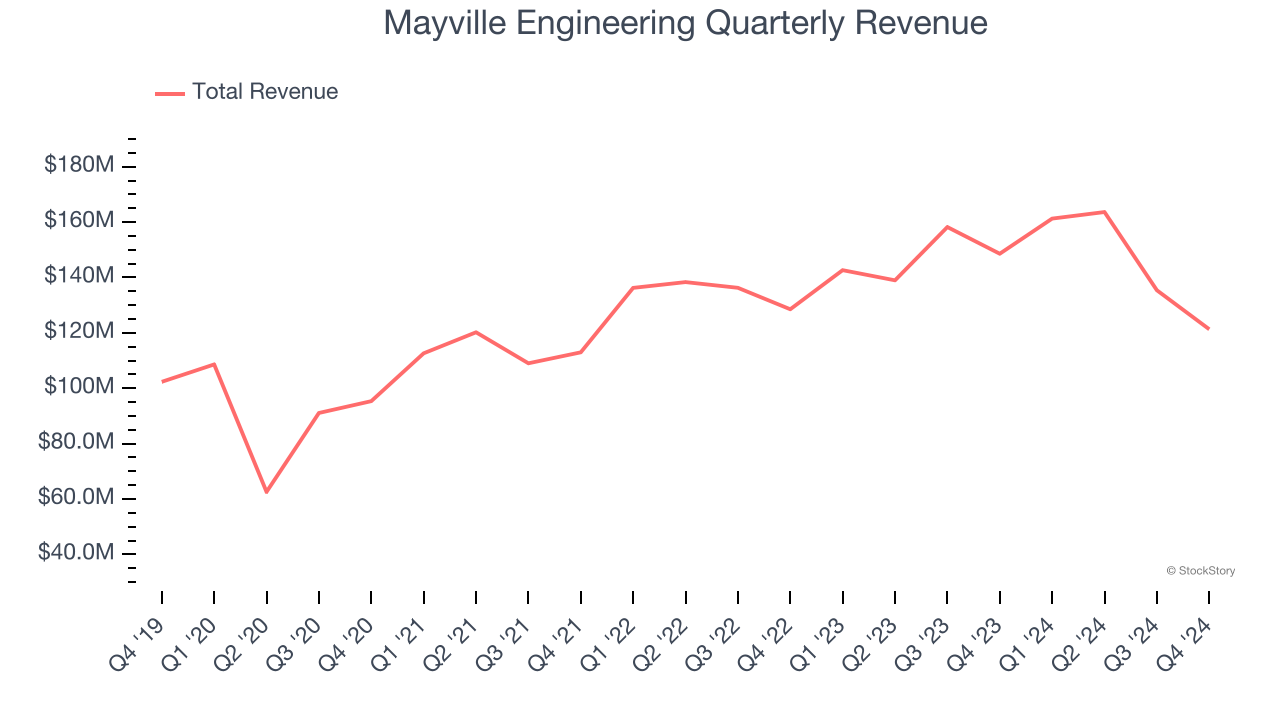
We at StockStory place the most emphasis on long-term growth, but within industrials, a half-decade historical view may miss cycles, industry trends, or a company capitalizing on catalysts such as a new contract win or a successful product line. Mayville Engineering’s annualized revenue growth of 3.8% over the last two years is above its five-year trend, but we were still disappointed by the results. 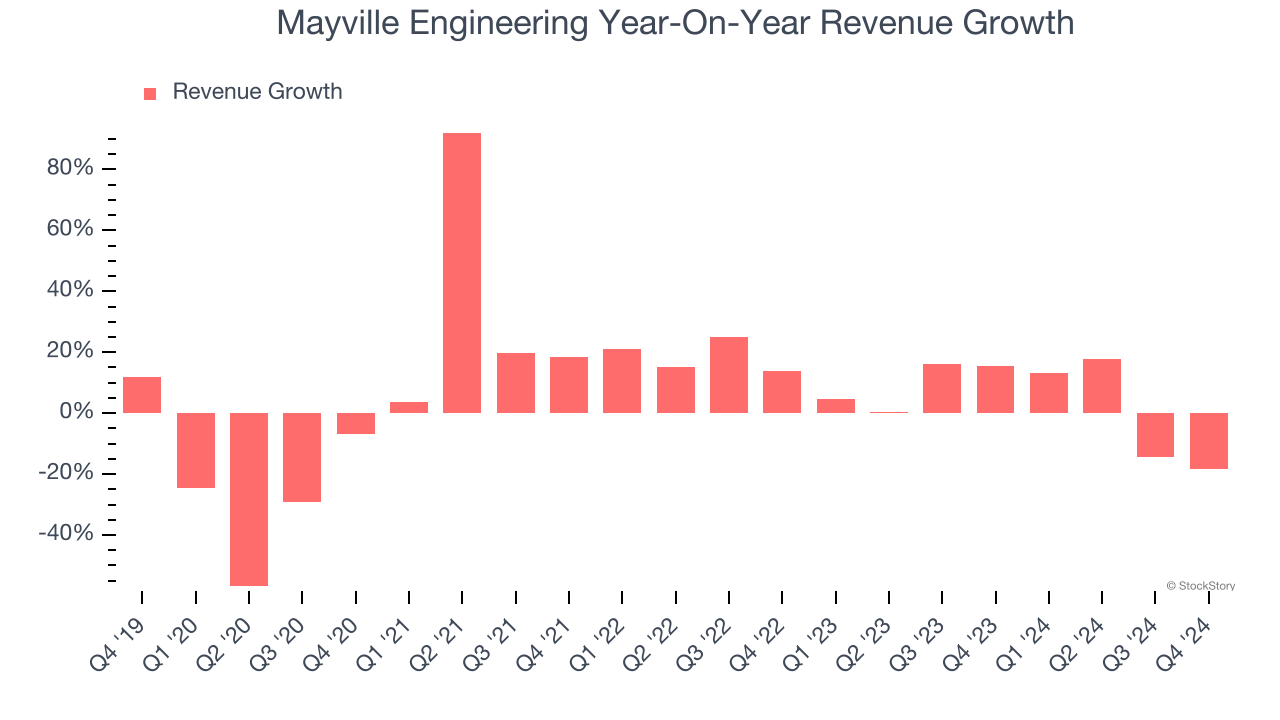
We can dig further into the company’s revenue dynamics by analyzing its most important segments, Commercial Vehicle and Construction & Access, which are 38.9% and 14% of revenue. Over the last two years, Mayville Engineering’s Commercial Vehicle revenue (exhaust, engine components, fuel systems) averaged 1.7% year-on-year growth. On the other hand, its Construction & Access revenue (fenders, hoods, frames for heavy machinery) averaged 8.7% declines.
This quarter, Mayville Engineering missed Wall Street’s estimates and reported a rather uninspiring 18.4% year-on-year revenue decline, generating $121.3 million of revenue.
Looking ahead, sell-side analysts expect revenue to remain flat over the next 12 months, a deceleration versus the last two years. This projection is underwhelming and indicates its products and services will see some demand headwinds.
Today’s young investors won’t have read the timeless lessons in Gorilla Game: Picking Winners In High Technology because it was written more than 20 years ago when Microsoft and Apple were first establishing their supremacy. But if we apply the same principles, then enterprise software stocks leveraging their own generative AI capabilities may well be the Gorillas of the future. So, in that spirit, we are excited to present our Special Free Report on a profitable, fast-growing enterprise software stock that is already riding the automation wave and looking to catch the generative AI next.
Operating Margin
Operating margin is one of the best measures of profitability because it tells us how much money a company takes home after procuring and manufacturing its products, marketing and selling those products, and most importantly, keeping them relevant through research and development.
Mayville Engineering was profitable over the last five years but held back by its large cost base. Its average operating margin of 3% was weak for an industrials business. This result isn’t too surprising given its low gross margin as a starting point.
On the plus side, Mayville Engineering’s operating margin rose by 9.5 percentage points over the last five years, as its sales growth gave it immense operating leverage.
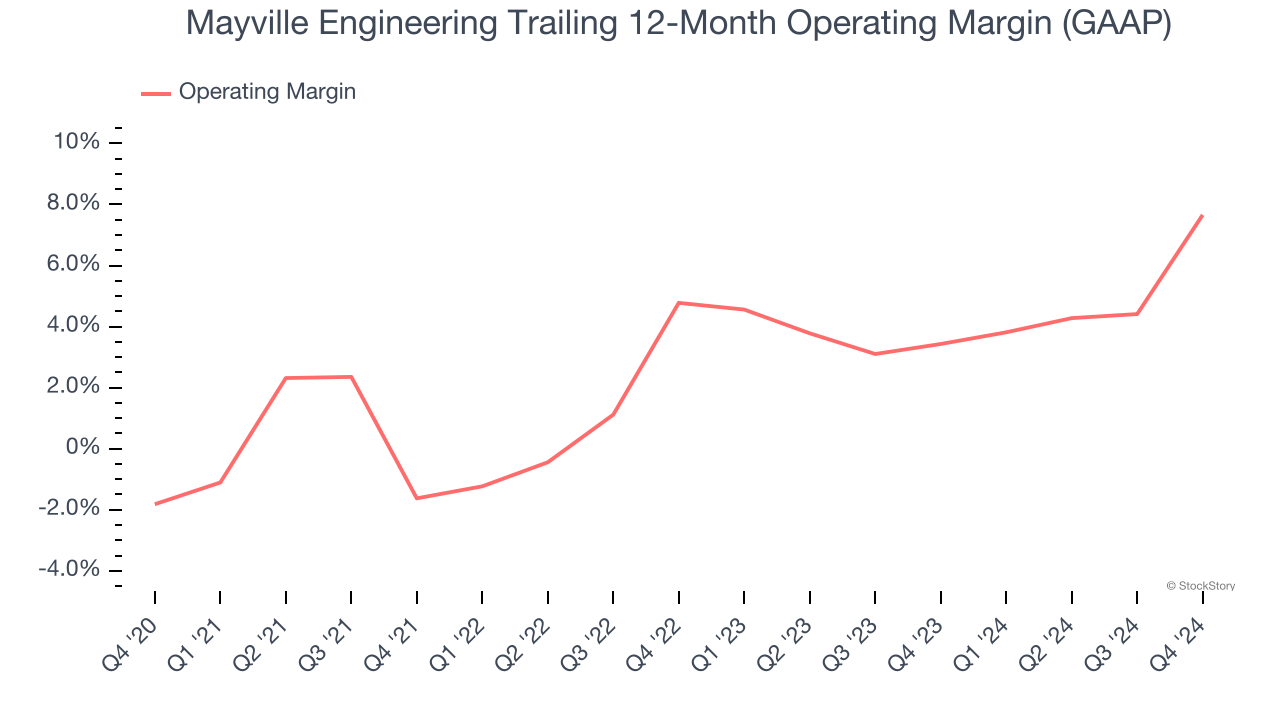
In Q4, Mayville Engineering generated an operating profit margin of 19%, up 15.4 percentage points year on year. The increase was solid, and since its revenue and gross margin actually decreased, we can assume it was recently more efficient because it trimmed its operating expenses like marketing, R&D, and administrative overhead.
Earnings Per Share
Revenue trends explain a company’s historical growth, but the long-term change in earnings per share (EPS) points to the profitability of that growth – for example, a company could inflate its sales through excessive spending on advertising and promotions.
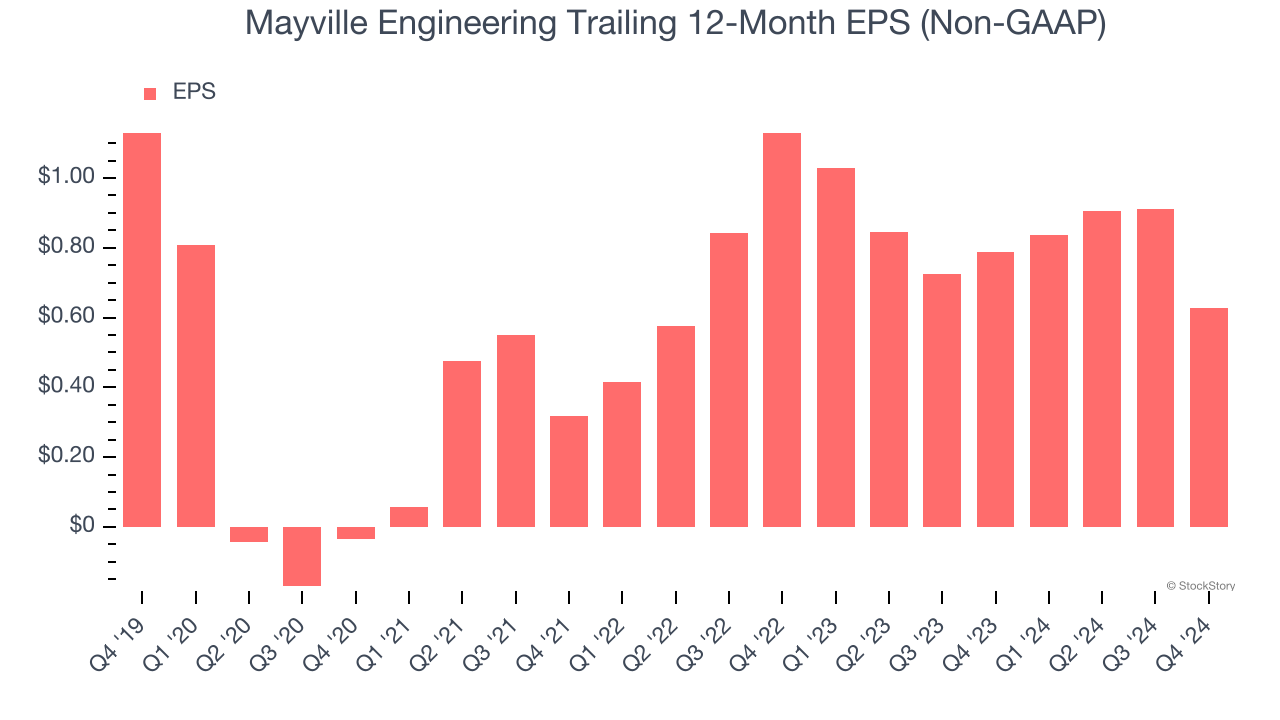
Sadly for Mayville Engineering, its EPS declined by 11.1% annually over the last five years while its revenue grew by 2.3%. However, its operating margin actually expanded during this time, telling us that non-fundamental factors such as interest and taxes affected its ultimate earnings.
Diving into the nuances of Mayville Engineering’s earnings can give us a better understanding of its performance. A five-year view shows Mayville Engineering has diluted its shareholders, growing its share count by 6.9%. This dilution overshadowed its increased operating efficiency and has led to lower per share earnings. Taxes and interest expenses can also affect EPS but don’t tell us as much about a company’s fundamentals. 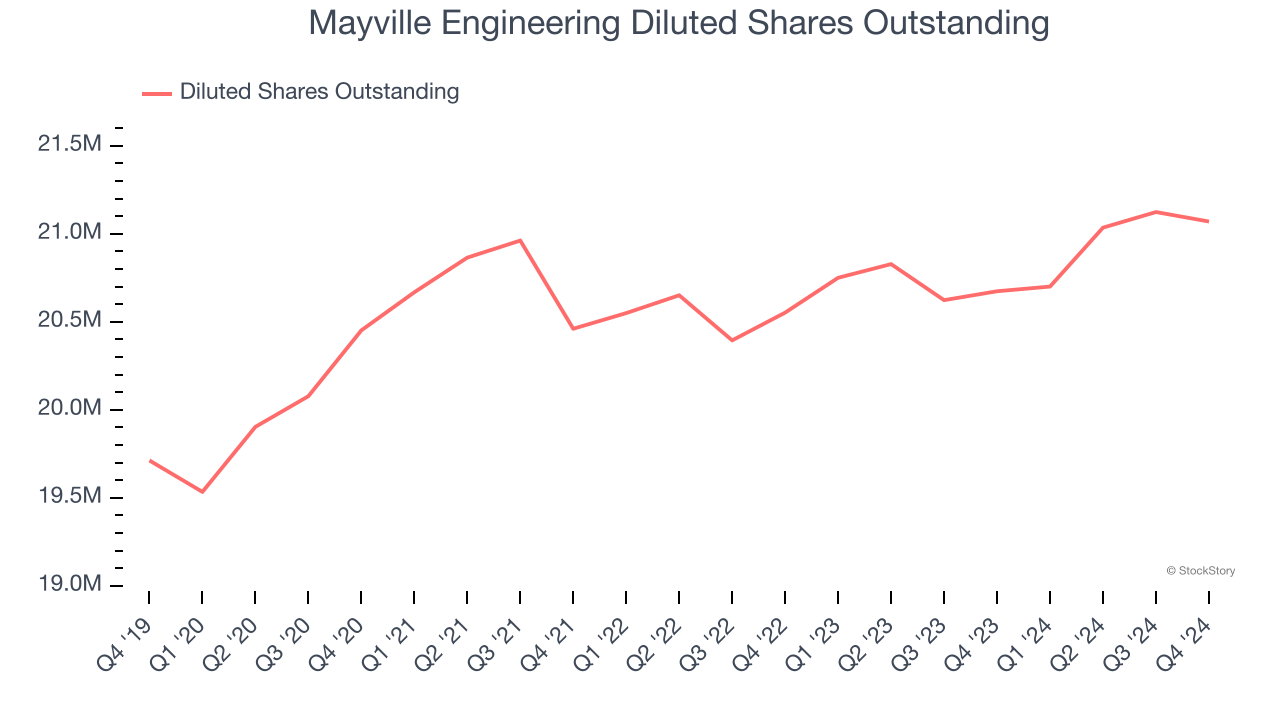
Like with revenue, we analyze EPS over a shorter period to see if we are missing a change in the business.
For Mayville Engineering, its two-year annual EPS declines of 25.5% show it’s continued to underperform. These results were bad no matter how you slice the data.
In Q4, Mayville Engineering reported EPS at negative $0.07, down from $0.21 in the same quarter last year. Despite falling year on year, this print easily cleared analysts’ estimates. We also like to analyze expected EPS growth based on Wall Street analysts’ consensus projections, but there is insufficient data.
Key Takeaways from Mayville Engineering’s Q4 Results
We enjoyed seeing Mayville Engineering beat analysts’ EPS expectations this quarter. That was one of the few bright spots, as revenue in the quarter missed. Looking ahead, its full-year revenue and EBITDA guidance both missed Wall Street’s estimates. Overall, the quarter could have been better. The stock remained flat at $13.79 immediately after reporting.
Big picture, is Mayville Engineering a buy here and now? If you’re making that decision, you should consider the bigger picture of valuation, business qualities, as well as the latest earnings. We cover that in our actionable full research report which you can read here, it’s free.