The end of an earnings season can be a great time to discover new stocks and assess how companies are handling the current business environment. Let’s take a look at how Sabre (NASDAQ: SABR) and the rest of the travel and vacation providers stocks fared in Q4.
Airlines, hotels, resorts, and cruise line companies often sell experiences rather than tangible products, and in the last decade-plus, consumers have slowly shifted from buying "things" (wasteful) to buying "experiences" (memorable). In addition, the internet has introduced new ways of approaching leisure and lodging such as booking homes and longer-term accommodations. Traditional airlines, hotel, resorts, and cruise line companies must innovate to stay relevant in a market rife with innovation.
The 17 travel and vacation providers stocks we track reported a mixed Q4. As a group, revenues beat analysts’ consensus estimates by 1.6% while next quarter’s revenue guidance was 3.5% above.
Amidst this news, share prices of the companies have had a rough stretch. On average, they are down 5.2% since the latest earnings results.
Sabre (NASDAQ: SABR)
Originally a division of American Airlines, Sabre (NASDAQ: SABR) is a technology provider for the global travel and tourism industry.
Sabre reported revenues of $714.7 million, up 4% year on year. This print was in line with analysts’ expectations, and overall, it was a strong quarter for the company with an impressive beat of analysts’ EPS estimates and full-year EBITDA guidance topping analysts’ expectations.
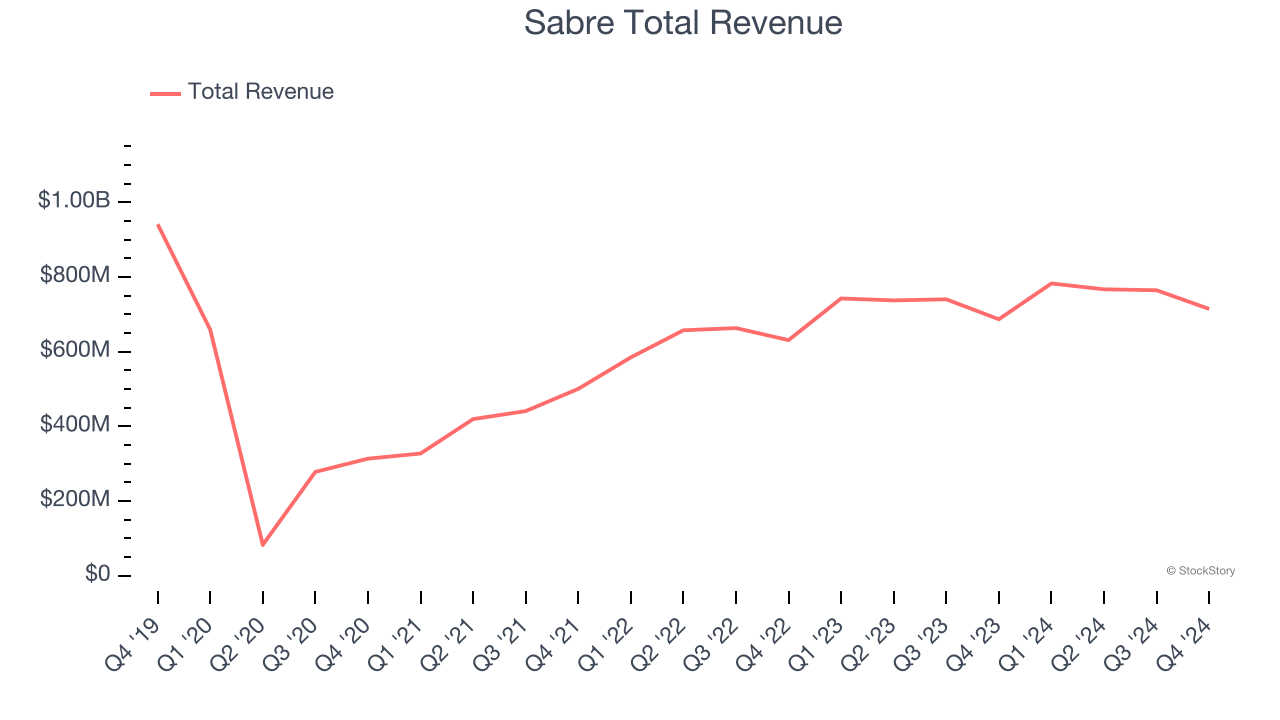
The stock is up 18.5% since reporting and currently trades at $4.03.
Is now the time to buy Sabre? Access our full analysis of the earnings results here, it’s free.
Best Q4: Choice Hotels (NYSE: CHH)
With almost 100% of its properties under franchise agreements, Choice Hotels (NYSE: CHH) is a hotel franchisor known for its diverse brand portfolio including Comfort Inn, Quality Inn, and Clarion.
Choice Hotels reported revenues of $389.8 million, up 8.8% year on year, outperforming analysts’ expectations by 2.8%. The business had a strong quarter with a solid beat of analysts’ adjusted operating income estimates and full-year EBITDA guidance topping analysts’ expectations.
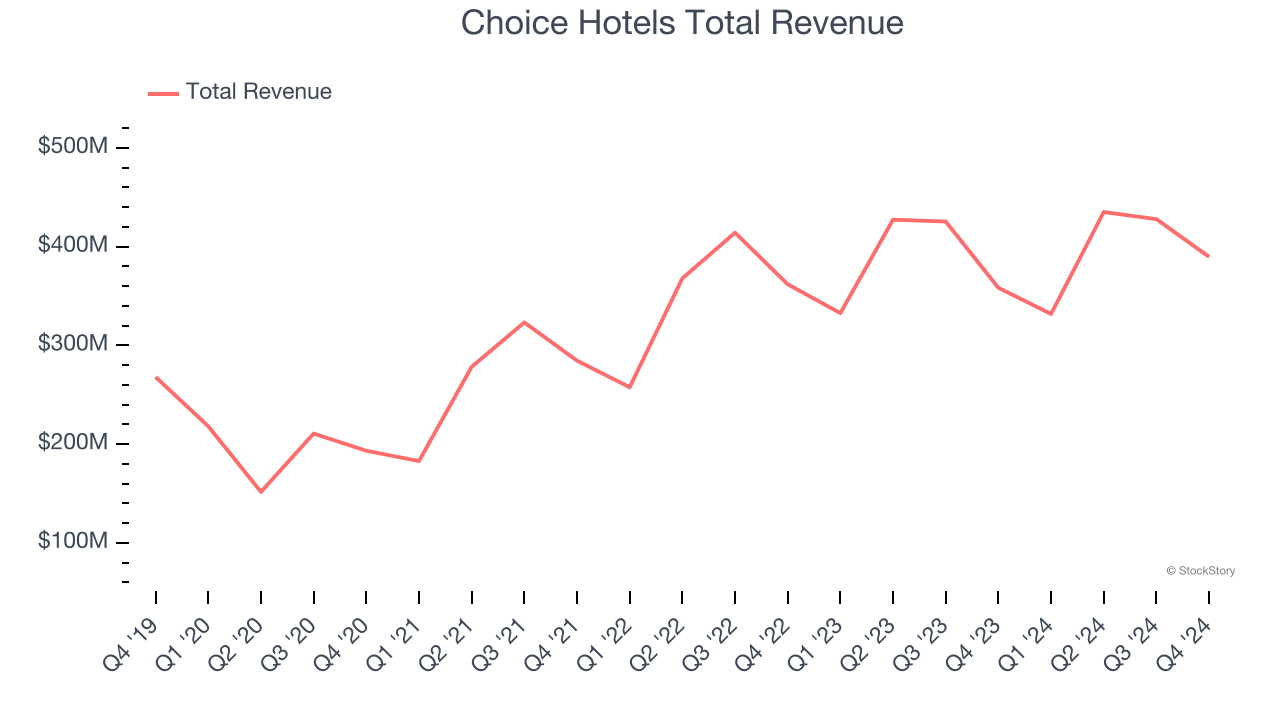
Although it had a fine quarter compared to its peers, the market seems unhappy with the results as the stock is down 2.5% since reporting. It currently trades at $144.07.
Is now the time to buy Choice Hotels? Access our full analysis of the earnings results here, it’s free.
Weakest Q4: Hyatt Hotels (NYSE: H)
Founded in 1957, Hyatt Hotels (NYSE: H) is a global hospitality company with a portfolio of 20 premier brands and over 950 properties across 65 countries.
Hyatt Hotels reported revenues of $1.60 billion, down 3.5% year on year, falling short of analysts’ expectations by 3.1%. It was a softer quarter as it posted a miss of analysts’ adjusted operating income and EPS estimates.
Hyatt Hotels delivered the weakest performance against analyst estimates in the group. As expected, the stock is down 13.8% since the results and currently trades at $139.88.
Read our full analysis of Hyatt Hotels’s results here.
Lindblad Expeditions (NASDAQ: LIND)
Founded by explorer Sven-Olof Lindblad in 1979, Lindblad Expeditions (NASDAQ: LIND) offers cruising experiences to remote destinations in partnership with National Geographic.
Lindblad Expeditions reported revenues of $148.6 million, up 18.5% year on year. This number surpassed analysts’ expectations by 10.2%. Taking a step back, it was a mixed quarter as it also logged full-year revenue guidance exceeding analysts’ expectations but a significant miss of analysts’ adjusted operating income estimates.
Lindblad Expeditions scored the biggest analyst estimates beat among its peers. The stock is down 1.3% since reporting and currently trades at $10.98.
Read our full, actionable report on Lindblad Expeditions here, it’s free.
Carnival (NYSE: CCL)
Boasting outrageous amenities like a planetarium on board its ships, Carnival (NYSE: CCL) is one of the world's largest leisure travel companies and a prominent player in the cruise industry.
Carnival reported revenues of $5.94 billion, up 10% year on year. This print met analysts’ expectations. Overall, it was a strong quarter as it also logged a solid beat of analysts’ EPS estimates and a decent beat of analysts’ adjusted operating income estimates.
The stock is down 8% since reporting and currently trades at $23.16.
Read our full, actionable report on Carnival here, it’s free.
Want to invest in winners with rock-solid fundamentals? Check out our Strong Momentum Stocks and add them to your watchlist. These companies are poised for growth regardless of the political or macroeconomic climate.
Join Paid Stock Investor Research
Help us make StockStory more helpful to investors like yourself. Join our paid user research session and receive a $50 Amazon gift card for your opinions. Sign up here.