3D printing company Stratasys (NASDAQ: SSYS) announced better-than-expected revenue in Q4 CY2024, but sales fell by 3.8% year on year to $150.4 million. On the other hand, the company’s full-year revenue guidance of $577.5 million at the midpoint came in 0.9% below analysts’ estimates. Its non-GAAP profit of $0.12 per share was in line with analysts’ consensus estimates.
Is now the time to buy Stratasys? Find out by accessing our full research report, it’s free.
Stratasys (SSYS) Q4 CY2024 Highlights:
- Revenue: $150.4 million vs analyst estimates of $148.9 million (3.8% year-on-year decline, 1% beat)
- Adjusted EPS: $0.12 vs analyst estimates of $0.11 (in line)
- Adjusted EBITDA: $14.48 million vs analyst estimates of $13.97 million (9.6% margin, 3.6% beat)
- Management’s revenue guidance for the upcoming financial year 2025 is $577.5 million at the midpoint, missing analyst estimates by 0.9% and implying 0.9% growth (vs -8.7% in FY2024)
- Adjusted EPS guidance for the upcoming financial year 2025 is $0.32 at the midpoint, missing analyst estimates by 10.6%
- EBITDA guidance for the upcoming financial year 2025 is $47 million at the midpoint, below analyst estimates of $49.86 million
- Operating Margin: -6.5%, down from 3.6% in the same quarter last year
- Market Capitalization: $757.4 million
Company Overview
Born from the Founder’s idea of making a toy frog with a glue gun, Stratasys (NASDAQ: SSYS) offers 3D printers and related materials, software, and services to many industries.
Custom Parts Manufacturing
Onshoring and inventory management–themes that grew in focus after COVID wreaked havoc on global supply chains–are tailwinds for companies that combine economies of scale with reliable service. Many in the space have adopted 3D printing to efficiently address the need for bespoke parts and components, but all companies are still at the whim of economic cycles. For example, consumer spending and interest rates can greatly impact the industrial production that drives demand for these companies’ offerings.
Sales Growth
A company’s long-term sales performance can indicate its overall quality. Any business can put up a good quarter or two, but many enduring ones grow for years. Over the last five years, Stratasys’s demand was weak and its revenue declined by 2.1% per year. This wasn’t a great result and suggests it’s a low quality business.
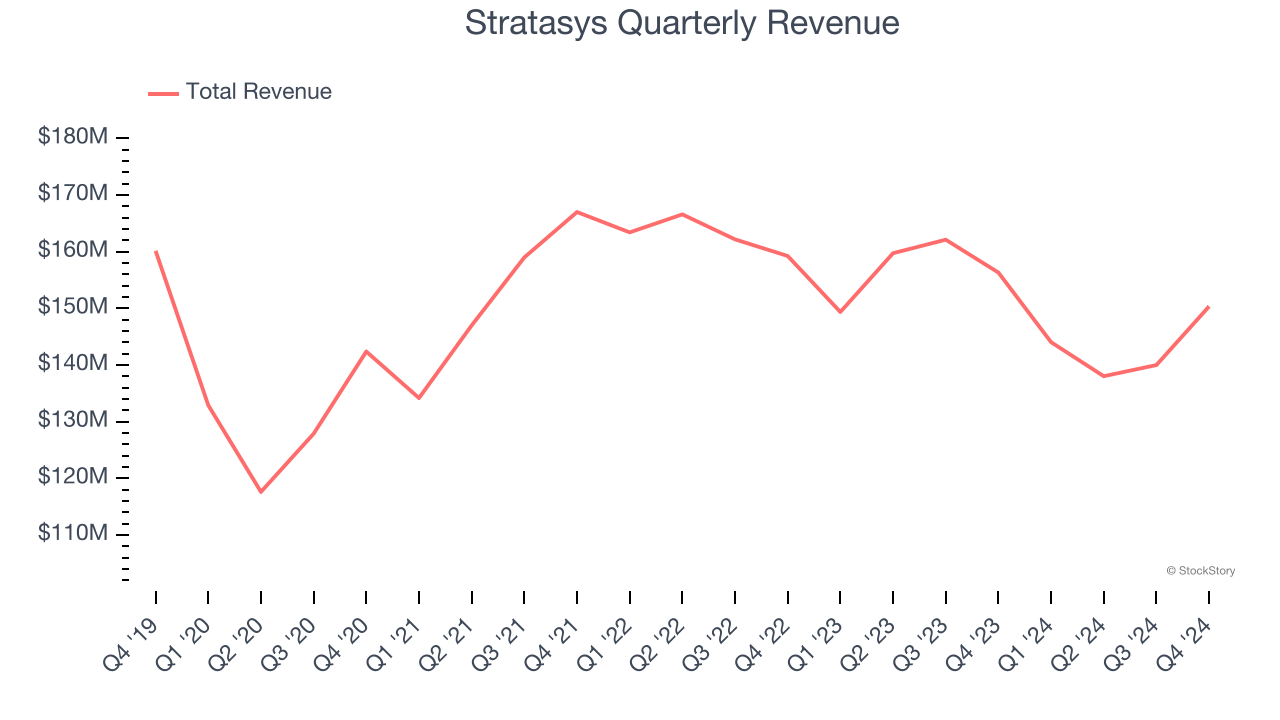
Long-term growth is the most important, but within industrials, a half-decade historical view may miss new industry trends or demand cycles. Stratasys’s recent history shows its demand has stayed suppressed as its revenue has declined by 6.3% annually over the last two years. 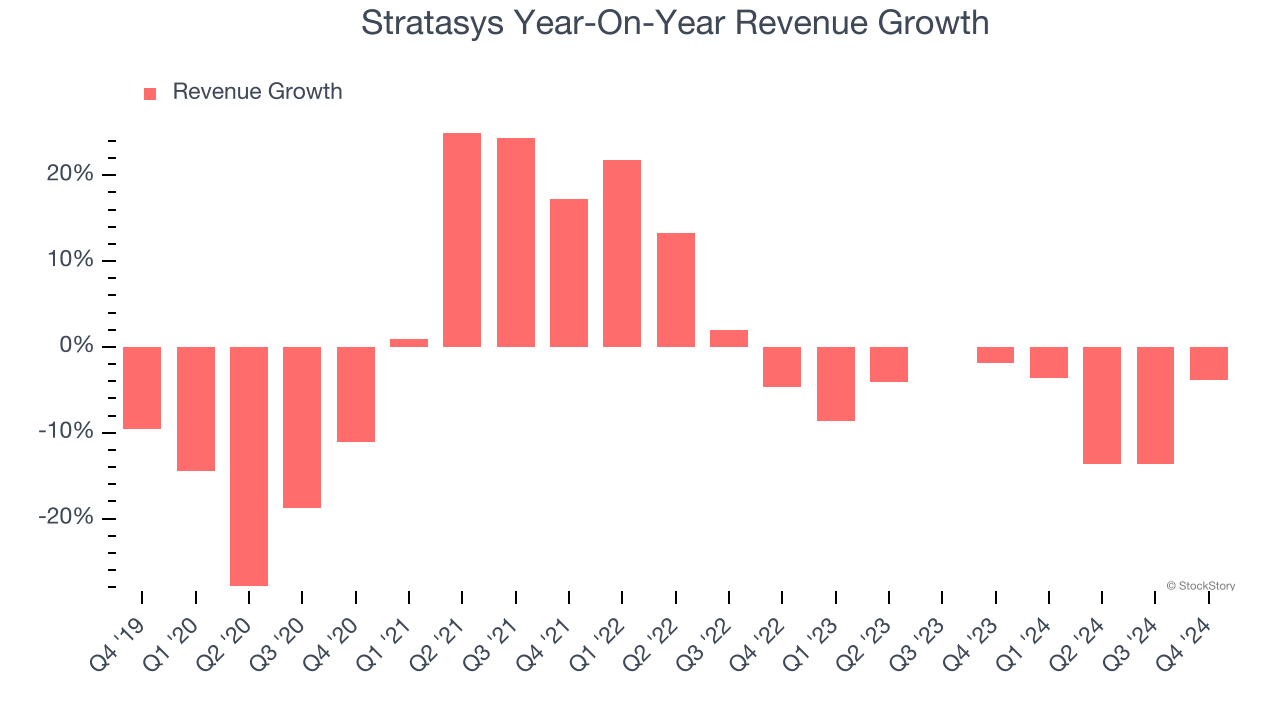
We can dig further into the company’s revenue dynamics by analyzing its most important segments, Products and Services, which are 69.9% and 30.1% of revenue. Over the last two years, Stratasys’s Products revenue (hard goods like 3D printers) averaged 6.7% year-on-year declines while its Services revenue (service contracts, consulting) averaged 4.8% declines.
This quarter, Stratasys’s revenue fell by 3.8% year on year to $150.4 million but beat Wall Street’s estimates by 1%.
Looking ahead, sell-side analysts expect revenue to grow 1.4% over the next 12 months. Although this projection implies its newer products and services will catalyze better top-line performance, it is still below the sector average.
Unless you’ve been living under a rock, it should be obvious by now that generative AI is going to have a huge impact on how large corporations do business. While Nvidia and AMD are trading close to all-time highs, we prefer a lesser-known (but still profitable) stock benefiting from the rise of AI. Click here to access our free report one of our favorites growth stories.
Operating Margin
Stratasys’s high expenses have contributed to an average operating margin of negative 25.7% over the last five years. Unprofitable industrials companies require extra attention because they could get caught swimming naked when the tide goes out. It’s hard to trust that the business can endure a full cycle.
On the plus side, Stratasys’s operating margin rose by 72.6 percentage points over the last five years. Still, it will take much more for the company to reach long-term profitability.
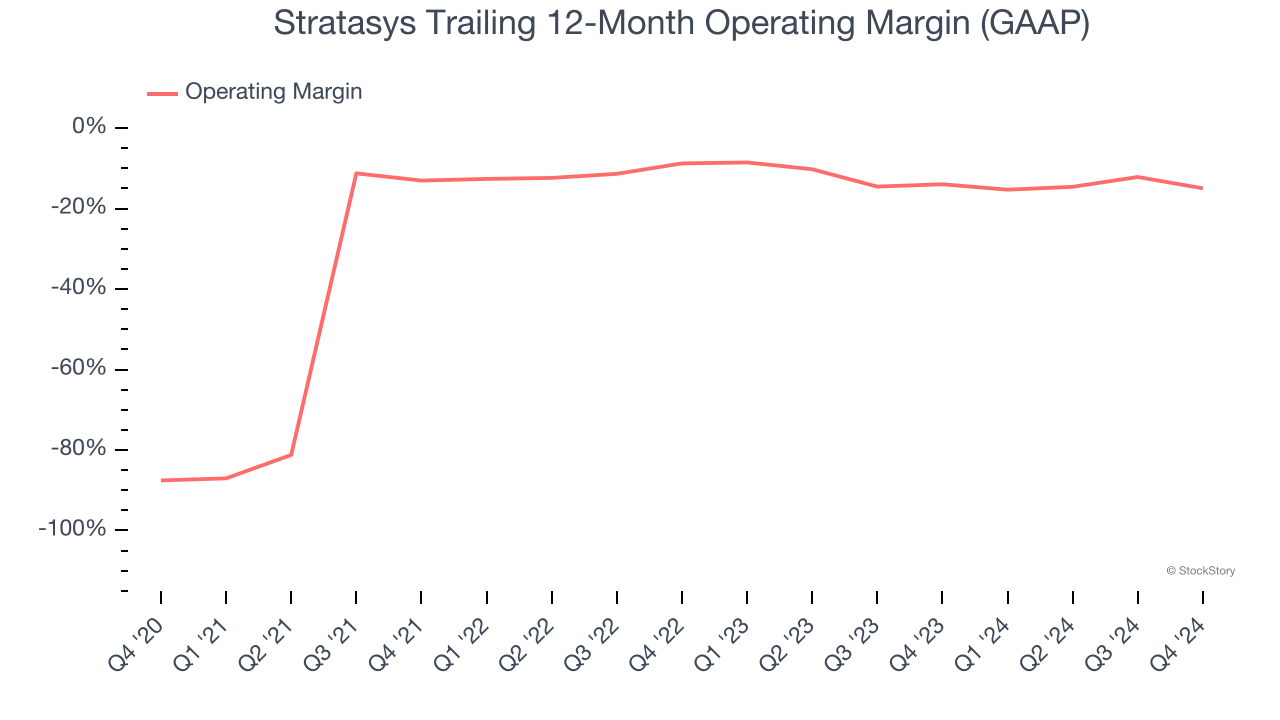
In Q4, Stratasys generated a negative 6.5% operating margin. The company's consistent lack of profits raise a flag.
Earnings Per Share
Revenue trends explain a company’s historical growth, but the long-term change in earnings per share (EPS) points to the profitability of that growth – for example, a company could inflate its sales through excessive spending on advertising and promotions.
Sadly for Stratasys, its EPS declined by more than its revenue over the last five years, dropping 34% annually. However, its operating margin actually expanded during this time, telling us that non-fundamental factors such as interest and taxes affected its ultimate earnings.
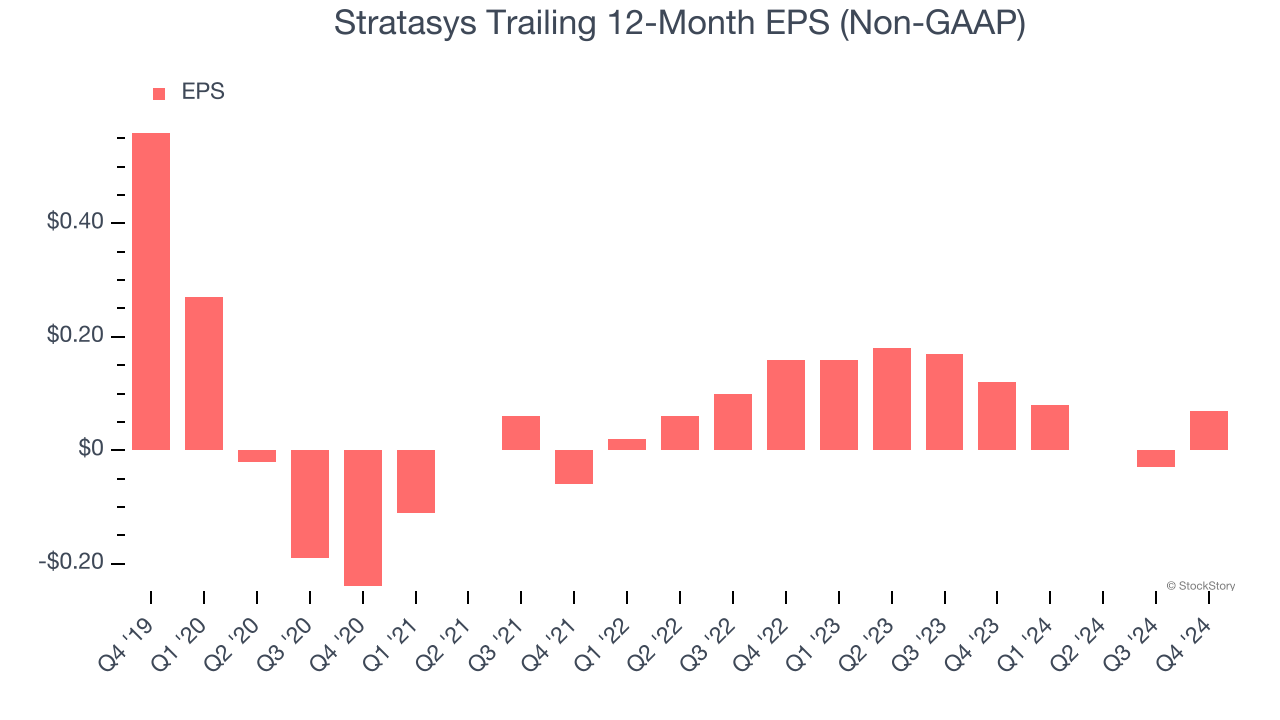
Diving into the nuances of Stratasys’s earnings can give us a better understanding of its performance. A five-year view shows Stratasys has diluted its shareholders, growing its share count by 31.2%. This dilution overshadowed its increased operating efficiency and has led to lower per share earnings. Taxes and interest expenses can also affect EPS but don’t tell us as much about a company’s fundamentals. 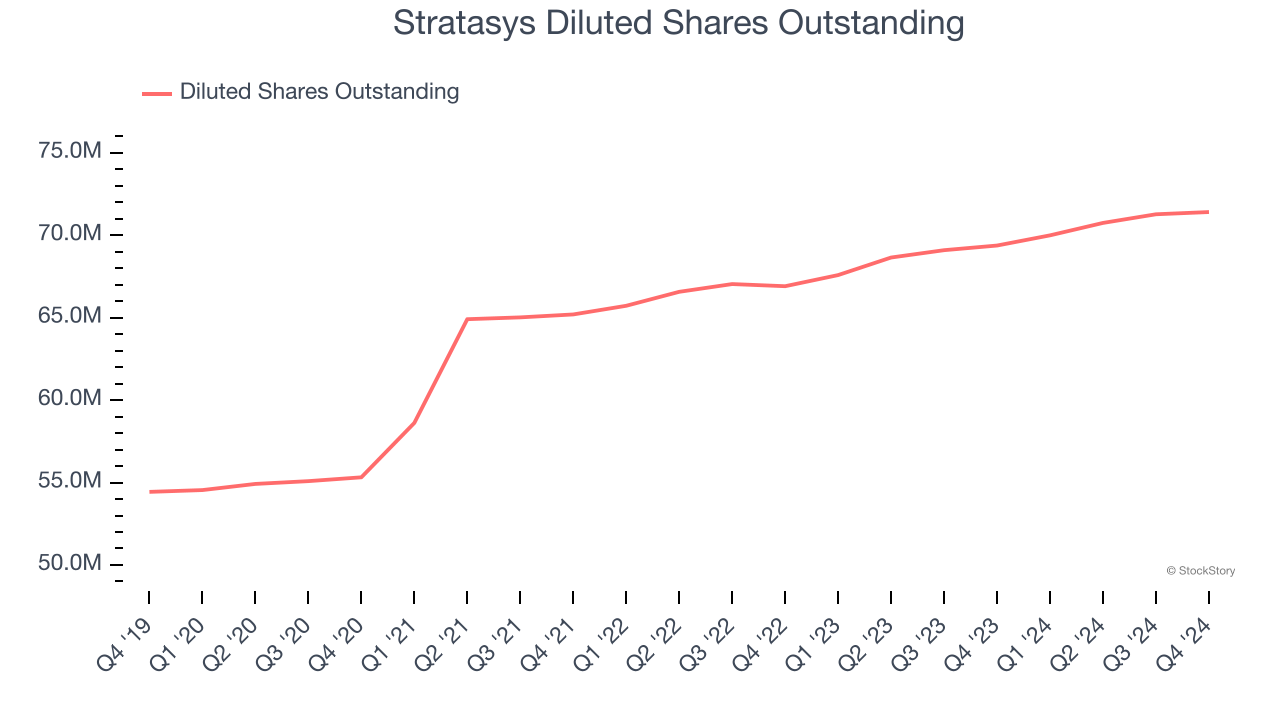
Like with revenue, we analyze EPS over a more recent period because it can provide insight into an emerging theme or development for the business.
For Stratasys, its two-year annual EPS declines of 33.9% are similar to its five-year trend. These results were bad no matter how you slice the data.
In Q4, Stratasys reported EPS at $0.12, up from $0.02 in the same quarter last year. This print beat analysts’ estimates by 6.7%. Over the next 12 months, Wall Street expects Stratasys to perform poorly. Analysts forecast its full-year EPS of $0.07 will hit $0.35.
Key Takeaways from Stratasys’s Q4 Results
It was encouraging to see Stratasys beat analysts’ EBITDA expectations this quarter. We were also happy its revenue narrowly outperformed Wall Street’s estimates. On the other hand, its full-year revenue and EBITDA guidance both missed Wall Street’s estimates. Overall, this quarter could have been better. The stock traded down 5.7% to $10 immediately after reporting.
So do we think Stratasys is an attractive buy at the current price? If you’re making that decision, you should consider the bigger picture of valuation, business qualities, as well as the latest earnings. We cover that in our actionable full research report which you can read here, it’s free.