
Medical device company CooperCompanies (NASDAQ: COO) fell short of the market’s revenue expectations in Q4 CY2024 as sales rose 3.6% year on year to $964.7 million. On the other hand, the company’s outlook for the full year was close to analysts’ estimates with revenue guided to $4.12 billion at the midpoint. Its non-GAAP profit of $0.92 per share was in line with analysts’ consensus estimates.
Is now the time to buy CooperCompanies? Find out by accessing our full research report, it’s free.
CooperCompanies (COO) Q4 CY2024 Highlights:
- Revenue: $964.7 million vs analyst estimates of $980.4 million (3.6% year-on-year growth, 1.6% miss)
- Adjusted EPS: $0.92 vs analyst estimates of $0.91 (in line)
- The company reconfirmed its revenue guidance for the full year of $4.12 billion at the midpoint
- Management slightly raised its full-year Adjusted EPS guidance to $3.98 at the midpoint
- Operating Margin: 18.9%, up from 16.4% in the same quarter last year
- Organic Revenue rose 6% year on year (7.5% in the same quarter last year)
- Market Capitalization: $18.23 billion
Commenting on the results, Al White, Cooper's President and CEO said, "We started the year on a positive note meeting our revenue expectations and exceeding our operational targets. Moving forward, we remain confident in our ability to deliver strong growth and operational excellence, and this is reflected in our guidance."
Company Overview
Founded in 1958, CooperCompanies (NASDAQ: COO) develops and manufactures of products in the eye care and women's health sectors, with its key products including contact lenses and fertility treatments.
Medical Devices & Supplies - Diversified
The medical devices industry operates a business model that balances steady demand with significant investments in innovation and regulatory compliance. The industry benefits from recurring revenue streams tied to consumables, maintenance services, and incremental upgrades to the latest technologies. However, the capital-intensive nature of product development, coupled with lengthy regulatory pathways and the need for clinical validation, can weigh on profitability and timelines. In addition, there are constant pricing pressures from healthcare systems and insurers maximizing cost efficiency. Over the next several years, one tailwind is demographic–aging populations means rising chronic disease rates that drive greater demand for medical interventions and monitoring solutions. Advances in digital health, such as remote patient monitoring and smart devices, are also expected to unlock new demand by shortening upgrade cycles. On the other hand, the industry faces headwinds from pricing and reimbursement pressures as healthcare providers increasingly adopt value-based care models. Additionally, the integration of cybersecurity for connected devices adds further risk and complexity for device manufacturers.
Sales Growth
Reviewing a company’s long-term sales performance reveals insights into its quality. Any business can put up a good quarter or two, but many enduring ones grow for years. Thankfully, CooperCompanies’s 8% annualized revenue growth over the last five years was decent. Its growth was slightly above the average healthcare company and shows its offerings resonate with customers.
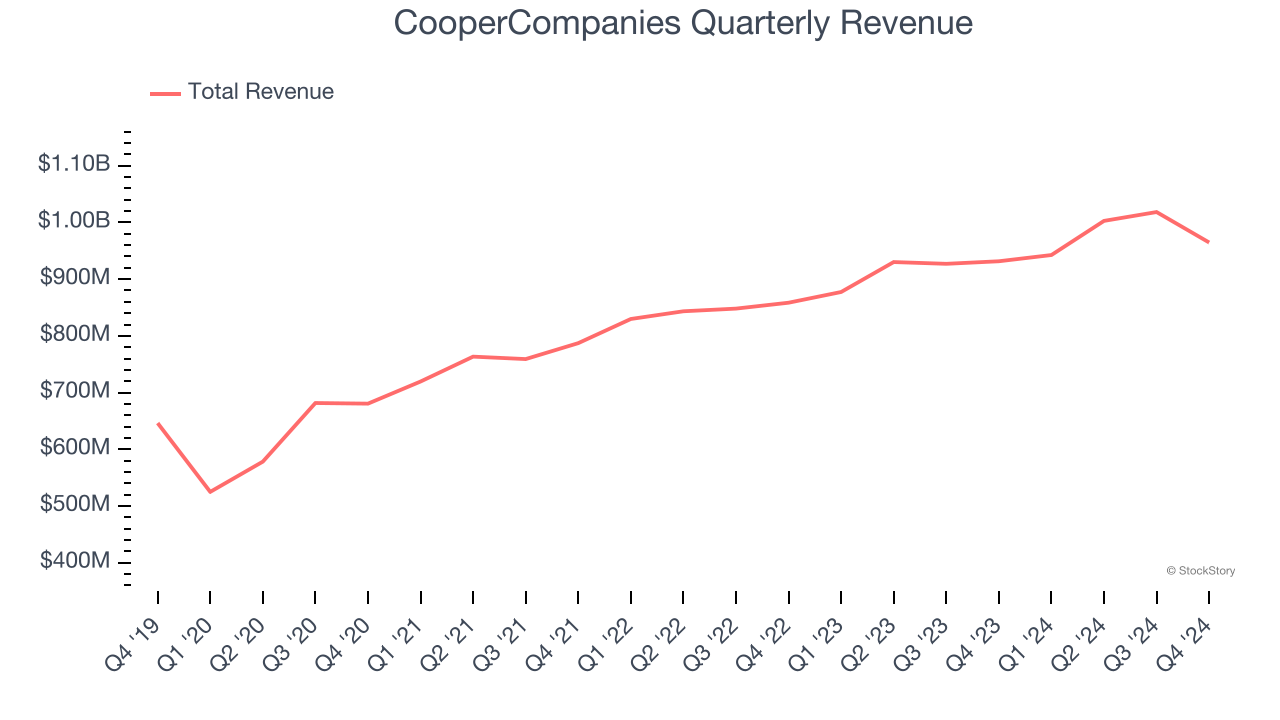
We at StockStory place the most emphasis on long-term growth, but within healthcare, a half-decade historical view may miss recent innovations or disruptive industry trends. CooperCompanies’s annualized revenue growth of 7.8% over the last two years aligns with its five-year trend, suggesting its demand was stable. 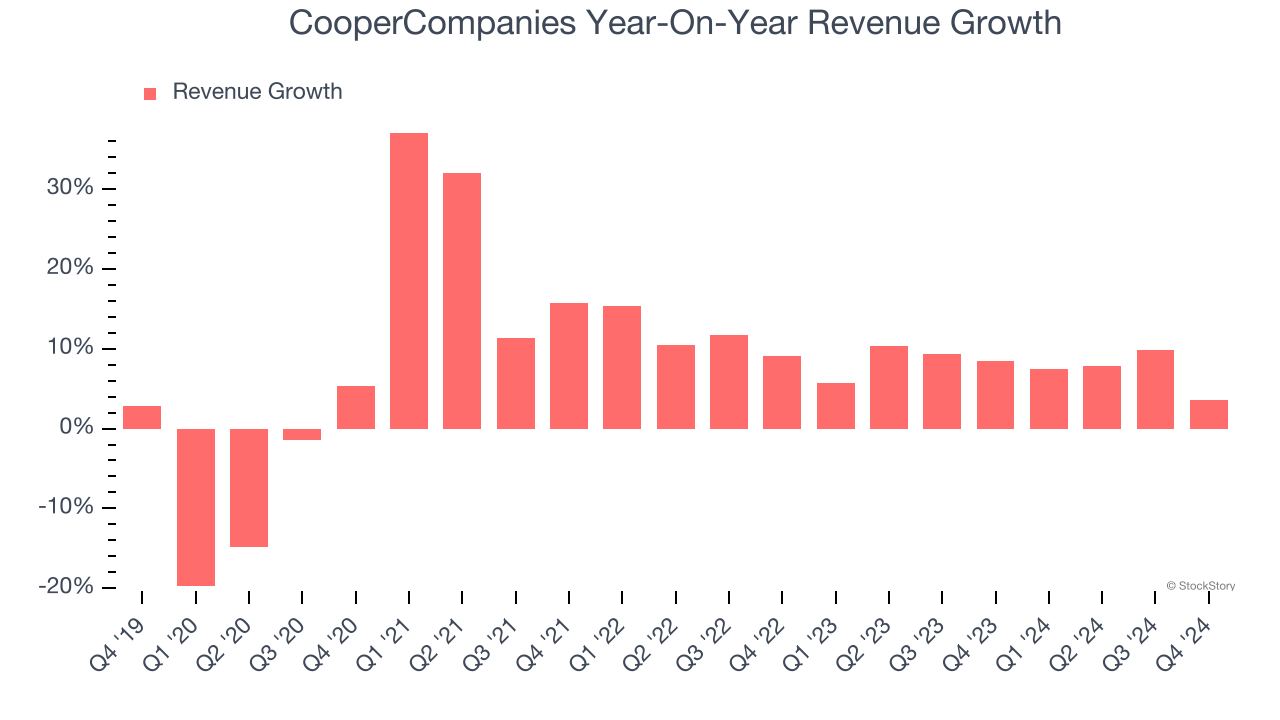
We can dig further into the company’s sales dynamics by analyzing its organic revenue, which strips out one-time events like acquisitions and currency fluctuations that don’t accurately reflect its fundamentals. Over the last two years, CooperCompanies’s organic revenue averaged 8.3% year-on-year growth. Because this number aligns with its normal revenue growth, we can see the company’s core operations (not acquisitions and divestitures) drove most of its results. 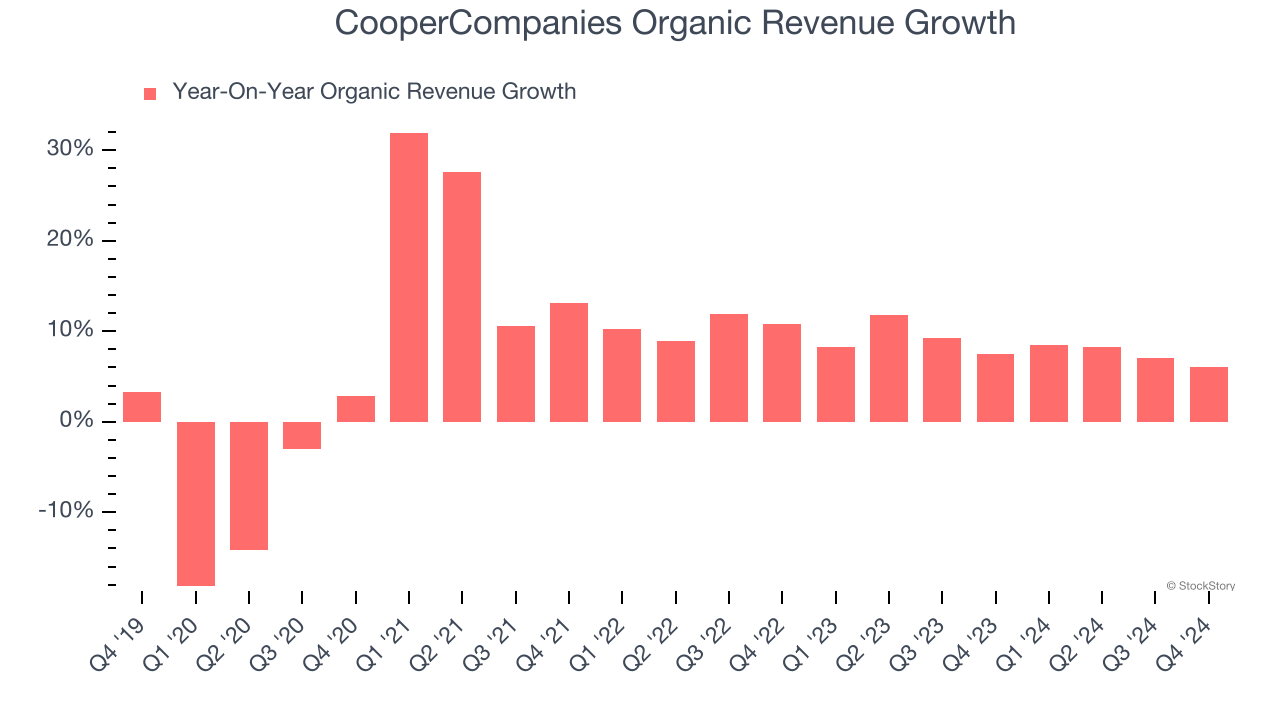
This quarter, CooperCompanies’s revenue grew by 3.6% year on year to $964.7 million, falling short of Wall Street’s estimates.
Looking ahead, sell-side analysts expect revenue to grow 6.6% over the next 12 months, similar to its two-year rate. Despite the slowdown, this projection is above the sector average and suggests the market sees some success for its newer products and services.
Here at StockStory, we certainly understand the potential of thematic investing. Diverse winners from Microsoft (MSFT) to Alphabet (GOOG), Coca-Cola (KO) to Monster Beverage (MNST) could all have been identified as promising growth stories with a megatrend driving the growth. So, in that spirit, we’ve identified a relatively under-the-radar profitable growth stock benefiting from the rise of AI, available to you FREE via this link.
Operating Margin
Operating margin is an important measure of profitability as it shows the portion of revenue left after accounting for all core expenses – everything from the cost of goods sold to advertising and wages. It’s also useful for comparing profitability across companies with different levels of debt and tax rates because it excludes interest and taxes.
CooperCompanies has managed its cost base well over the last five years. It demonstrated solid profitability for a healthcare business, producing an average operating margin of 16%.
Looking at the trend in its profitability, CooperCompanies’s operating margin rose by 5.1 percentage points over the last five years, as its sales growth gave it operating leverage. Zooming in on its more recent performance, we can see the company’s trajectory is intact as its margin has also increased by 3.1 percentage points on a two-year basis.
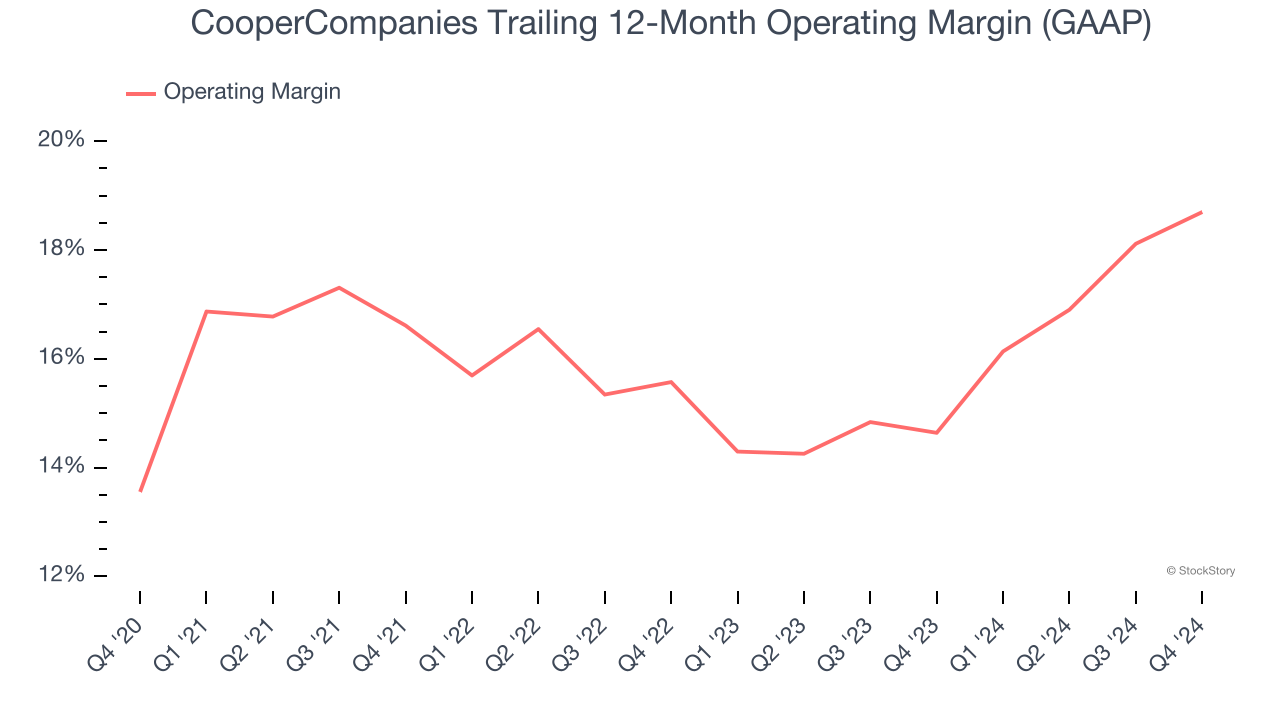
This quarter, CooperCompanies generated an operating profit margin of 18.9%, up 2.4 percentage points year on year. This increase was a welcome development and shows it was recently more efficient because its expenses grew slower than its revenue.
Earnings Per Share
We track the long-term change in earnings per share (EPS) for the same reason as long-term revenue growth. Compared to revenue, however, EPS highlights whether a company’s growth is profitable.
CooperCompanies’s EPS grew at an unimpressive 4.4% compounded annual growth rate over the last five years, lower than its 8% annualized revenue growth. However, its operating margin actually expanded during this time, telling us that non-fundamental factors such as interest expenses and taxes affected its ultimate earnings.
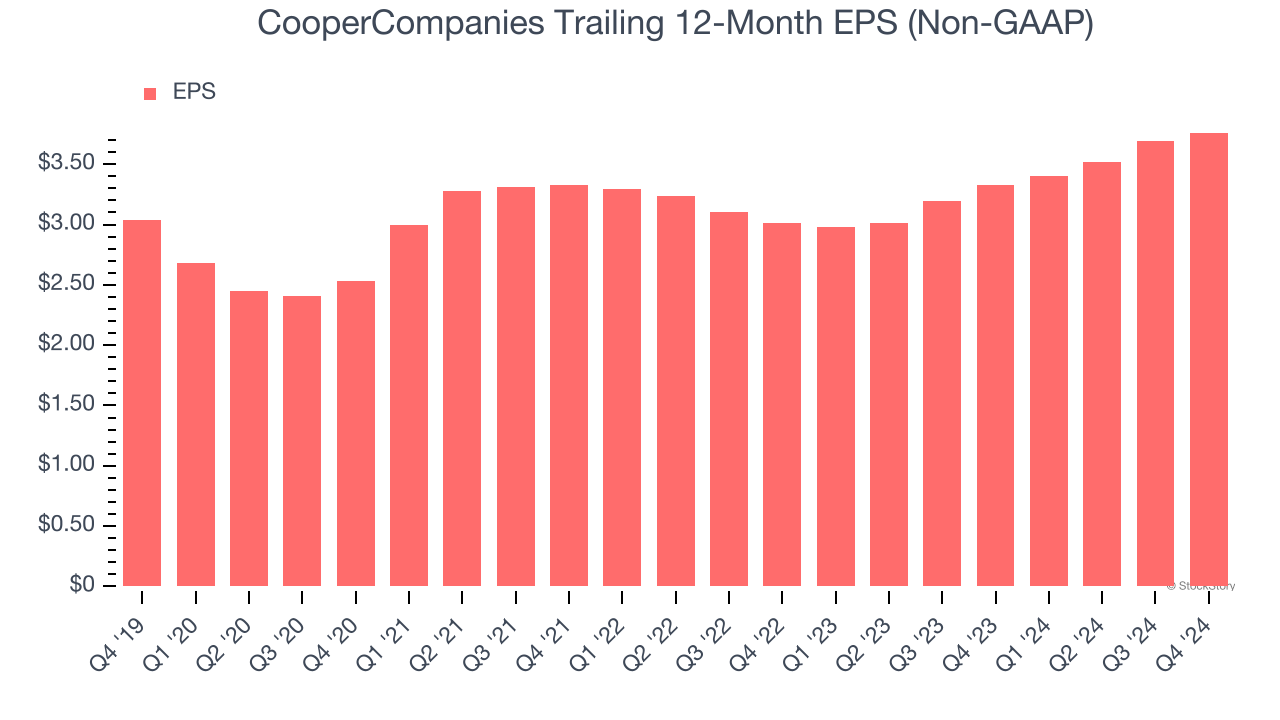
Diving into the nuances of CooperCompanies’s earnings can give us a better understanding of its performance. A five-year view shows CooperCompanies has diluted its shareholders, growing its share count by 1.2%. This dilution overshadowed its increased operating efficiency and has led to lower per share earnings. Taxes and interest expenses can also affect EPS but don’t tell us as much about a company’s fundamentals. 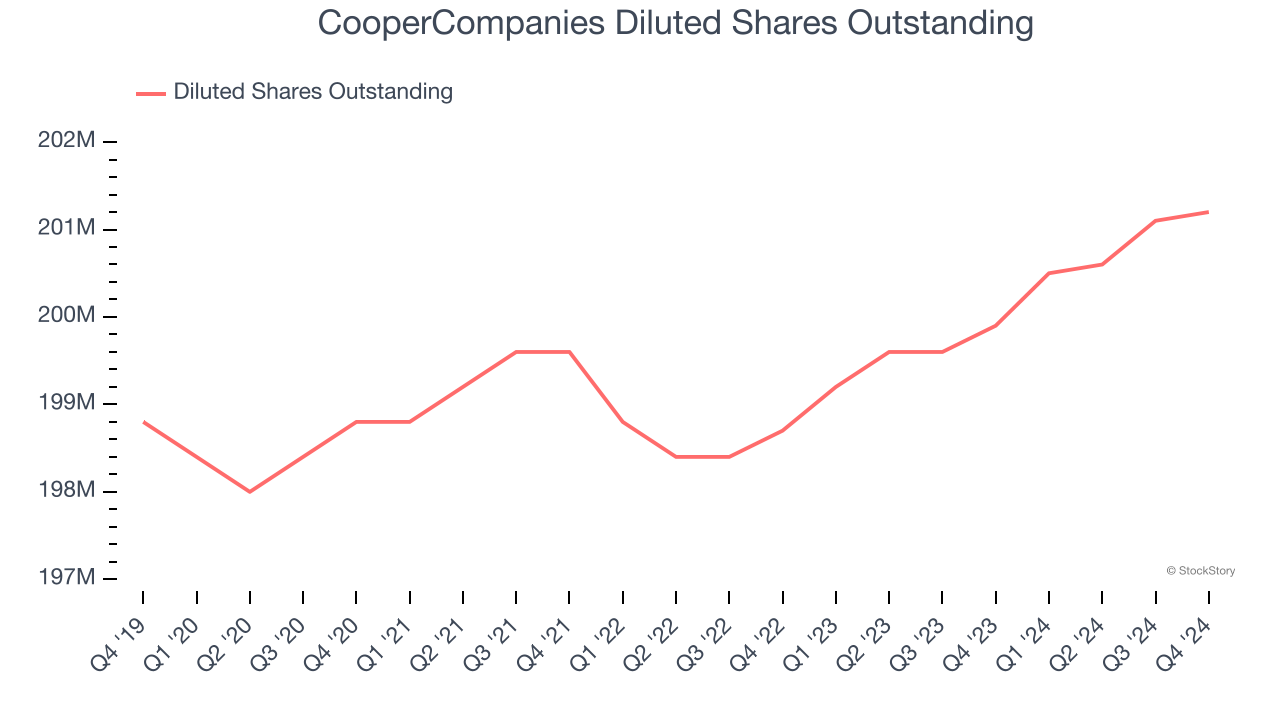
In Q4, CooperCompanies reported EPS at $0.92, up from $0.85 in the same quarter last year. This print was close to analysts’ estimates. Over the next 12 months, Wall Street expects CooperCompanies’s full-year EPS of $3.76 to grow 8.5%.
Key Takeaways from CooperCompanies’s Q4 Results
We struggled to find many positives in these results. For example, revenue missed, which is never a good sign. The stock traded down 11% to $81.07 immediately following the results.
CooperCompanies didn’t show it’s best hand this quarter, but does that create an opportunity to buy the stock right now? The latest quarter does matter, but not nearly as much as longer-term fundamentals and valuation, when deciding if the stock is a buy. We cover that in our actionable full research report which you can read here, it’s free.