American firearms manufacturer Smith & Wesson (NASDAQ: SWBI) fell short of the market’s revenue expectations in Q4 CY2024, with sales falling 15.7% year on year to $115.9 million. Its non-GAAP profit of $0.02 per share was in line with analysts’ consensus estimates.
Is now the time to buy Smith & Wesson? Find out by accessing our full research report, it’s free.
Smith & Wesson (SWBI) Q4 CY2024 Highlights:
- Revenue: $115.9 million vs analyst estimates of $119.5 million (15.7% year-on-year decline, 3% miss)
- Adjusted EPS: $0.02 vs analyst estimates of $0.02 (in line)
- Adjusted EBITDA: $13.28 million vs analyst estimates of $12.21 million (11.5% margin, 8.7% beat)
- Operating Margin: 3.6%, down from 9% in the same quarter last year
- Free Cash Flow was -$16.15 million, down from $7.16 million in the same quarter last year
- Market Capitalization: $475.2 million
Company Overview
With a history dating back to 1852, Smith & Wesson (NASDAQ: SWBI) is a firearms manufacturer known for its handguns and rifles.
Leisure Products
Leisure products cover a wide range of goods in the consumer discretionary sector. Maintaining a strong brand is key to success, and those who differentiate themselves will enjoy customer loyalty and pricing power while those who don’t may find themselves in precarious positions due to the non-essential nature of their offerings.
Sales Growth
A company’s long-term sales performance can indicate its overall quality. Even a bad business can shine for one or two quarters, but a top-tier one grows for years. Unfortunately, Smith & Wesson struggled to consistently increase demand as its $493 million of sales for the trailing 12 months was close to its revenue five years ago. This was below our standards and is a sign of poor business quality.
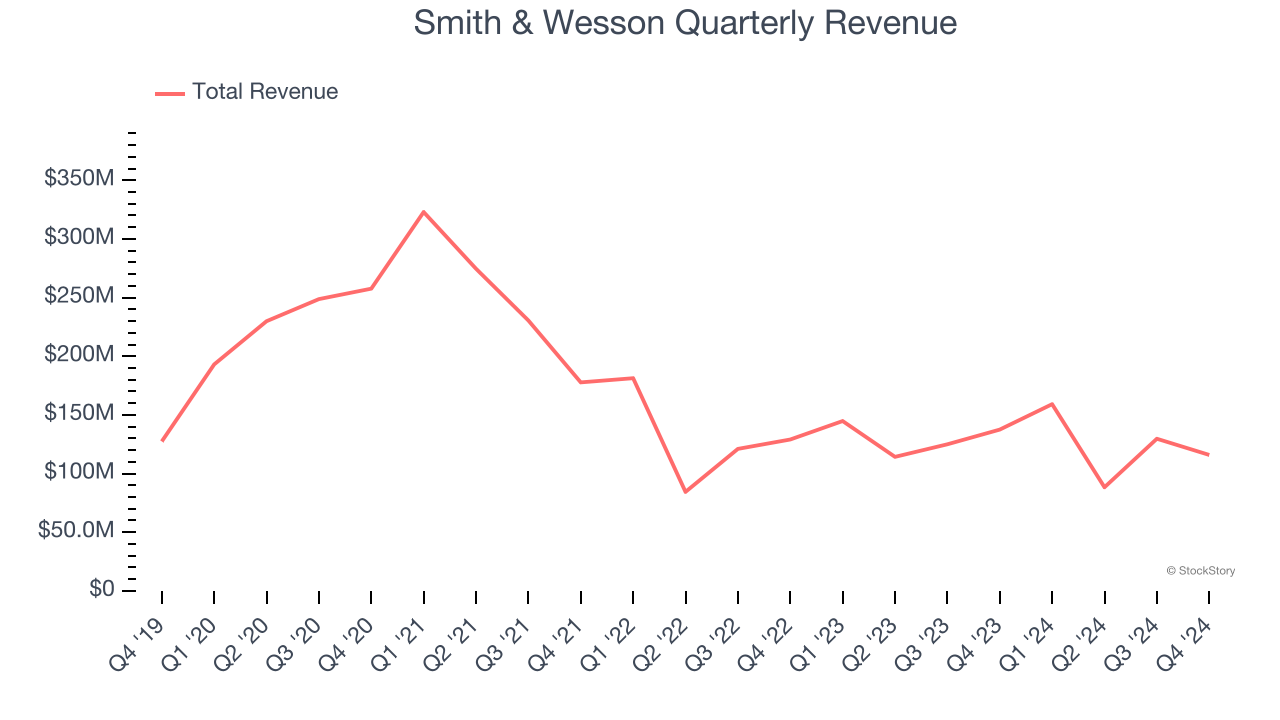
We at StockStory place the most emphasis on long-term growth, but within consumer discretionary, a stretched historical view may miss a company riding a successful new product or trend. Smith & Wesson’s recent history shows its demand remained suppressed as its revenue has declined by 2.2% annually over the last two years. 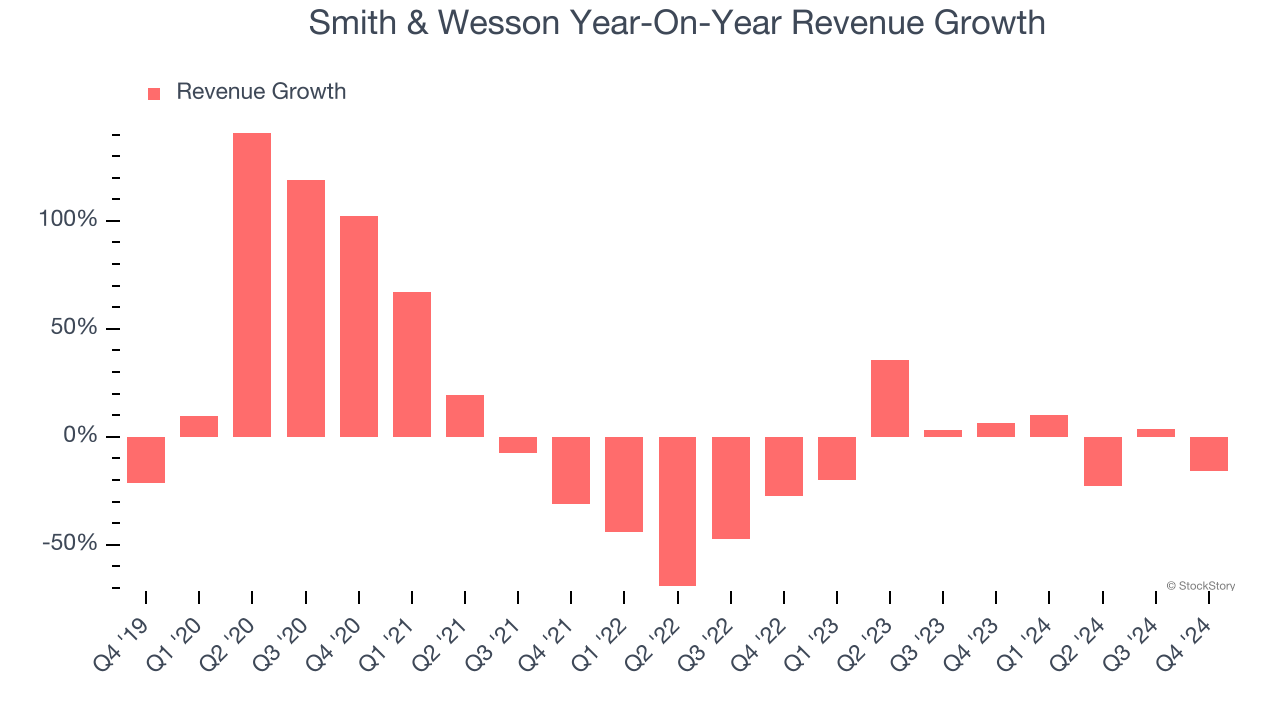
This quarter, Smith & Wesson missed Wall Street’s estimates and reported a rather uninspiring 15.7% year-on-year revenue decline, generating $115.9 million of revenue.
Looking ahead, sell-side analysts expect revenue to grow 2.7% over the next 12 months. Although this projection implies its newer products and services will spur better top-line performance, it is still below the sector average.
Software is eating the world and there is virtually no industry left that has been untouched by it. That drives increasing demand for tools helping software developers do their jobs, whether it be monitoring critical cloud infrastructure, integrating audio and video functionality, or ensuring smooth content streaming. Click here to access a free report on our 3 favorite stocks to play this generational megatrend.
Operating Margin
Smith & Wesson’s operating margin has been trending down over the last 12 months and averaged 8.3% over the last two years. The company’s profitability was mediocre for a consumer discretionary business and shows it couldn’t pass its higher operating expenses onto its customers.
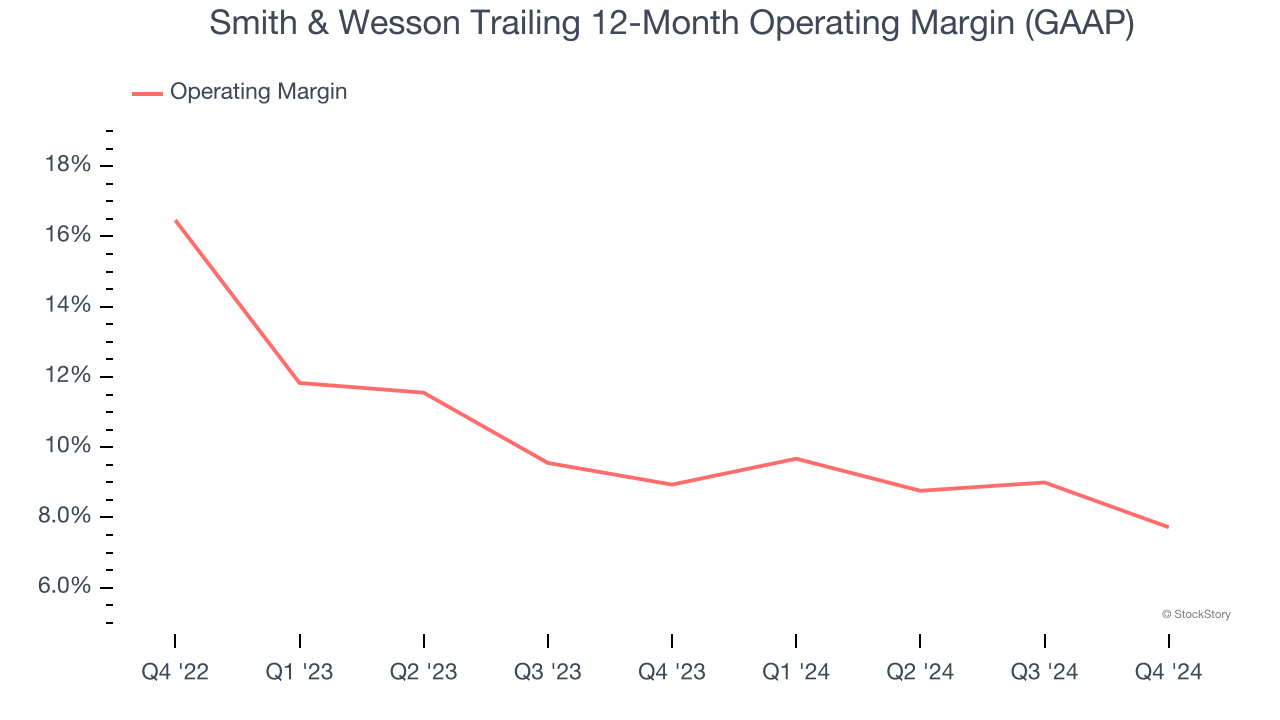
This quarter, Smith & Wesson generated an operating profit margin of 3.6%, down 5.4 percentage points year on year. This contraction shows it was recently less efficient because its expenses increased relative to its revenue.
Earnings Per Share
We track the long-term change in earnings per share (EPS) for the same reason as long-term revenue growth. Compared to revenue, however, EPS highlights whether a company’s growth is profitable.
Smith & Wesson’s EPS grew at a weak 1.9% compounded annual growth rate over the last five years. This performance was better than its flat revenue but doesn’t tell us much about its business quality because its operating margin didn’t expand.
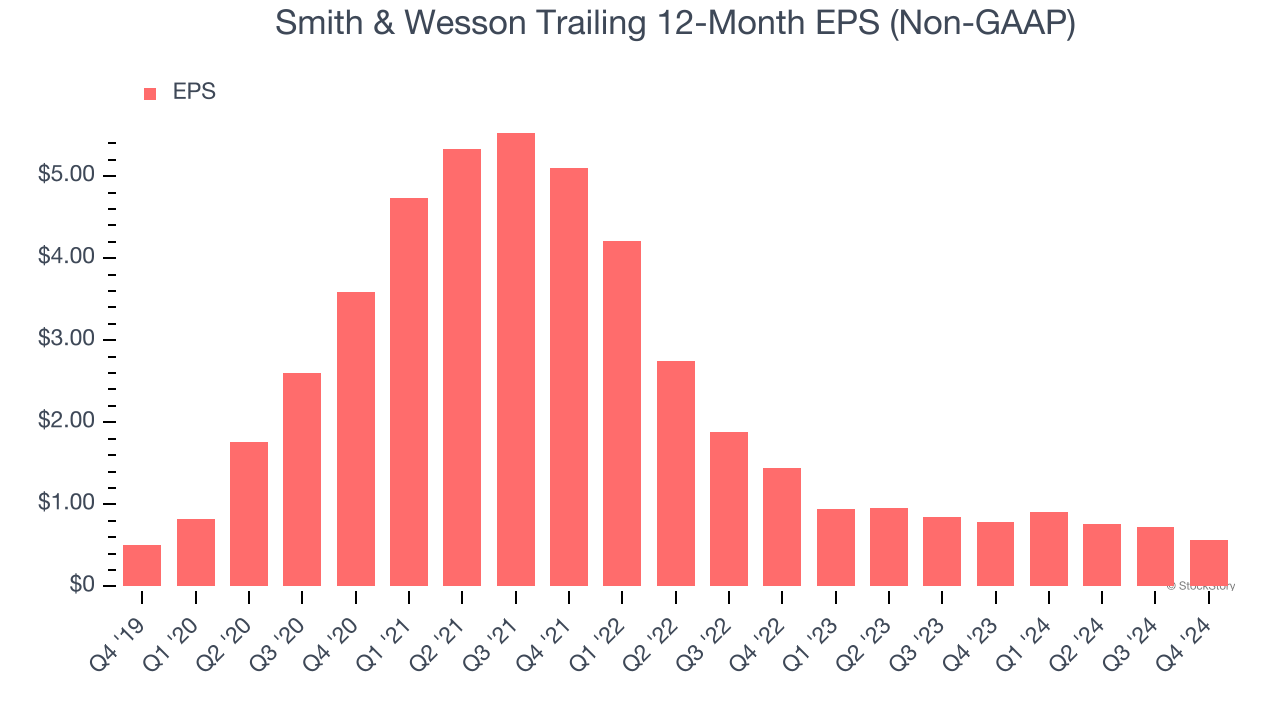
In Q4, Smith & Wesson reported EPS at $0.02, down from $0.19 in the same quarter last year. This print was close to analysts’ estimates. Over the next 12 months, Wall Street expects Smith & Wesson’s full-year EPS of $0.56 to stay about the same.
Key Takeaways from Smith & Wesson’s Q4 Results
It was encouraging to see Smith & Wesson beat analysts’ EBITDA expectations this quarter. On the other hand, its revenue missed. Overall, this was a weaker quarter. The stock traded down 8.1% to $10.15 immediately following the results.
Smith & Wesson didn’t show it’s best hand this quarter, but does that create an opportunity to buy the stock right now? If you’re making that decision, you should consider the bigger picture of valuation, business qualities, as well as the latest earnings. We cover that in our actionable full research report which you can read here, it’s free.