
Real estate technology company The Real Brokerage (NASDAQ: REAX) beat Wall Street’s revenue expectations in Q4 CY2024, with sales up 93.4% year on year to $350.6 million. Its GAAP loss of $0.03 per share was $0.02 above analysts’ consensus estimates.
Is now the time to buy The Real Brokerage? Find out by accessing our full research report, it’s free.
The Real Brokerage (REAX) Q4 CY2024 Highlights:
- Revenue: $350.6 million vs analyst estimates of $300.1 million (93.4% year-on-year growth, 16.8% beat)
- EPS (GAAP): -$0.03 vs analyst estimates of -$0.05 ($0.02 beat)
- Adjusted EBITDA: $9.07 million vs analyst estimates of $5.45 million (2.6% margin, 66.5% beat)
- Operating Margin: -1.8%, up from -6.2% in the same quarter last year
- Free Cash Flow was $4.00 million, up from -$6.04 million in the same quarter last year
- Market Capitalization: $977.9 million
Company Overview
Founded in Toronto, Canada in 2014, The Real Brokerage (NASDAQ: REAX) is a technology-driven real estate brokerage firm combining a tech-centric model with an agent-centric philosophy.
Real Estate Services
Technology has been a double-edged sword in real estate services. On the one hand, internet listings are effective at disseminating information far and wide, casting a wide net for buyers and sellers to increase the chances of transactions. On the other hand, digitization in the real estate market could potentially disintermediate key players like agents who use information asymmetries to their advantage.
Sales Growth
A company’s long-term sales performance can indicate its overall quality. Any business can put up a good quarter or two, but many enduring ones grow for years. Luckily, The Real Brokerage’s sales grew at an incredible 140% compounded annual growth rate over the last five years. Its growth beat the average consumer discretionary company and shows its offerings resonate with customers.
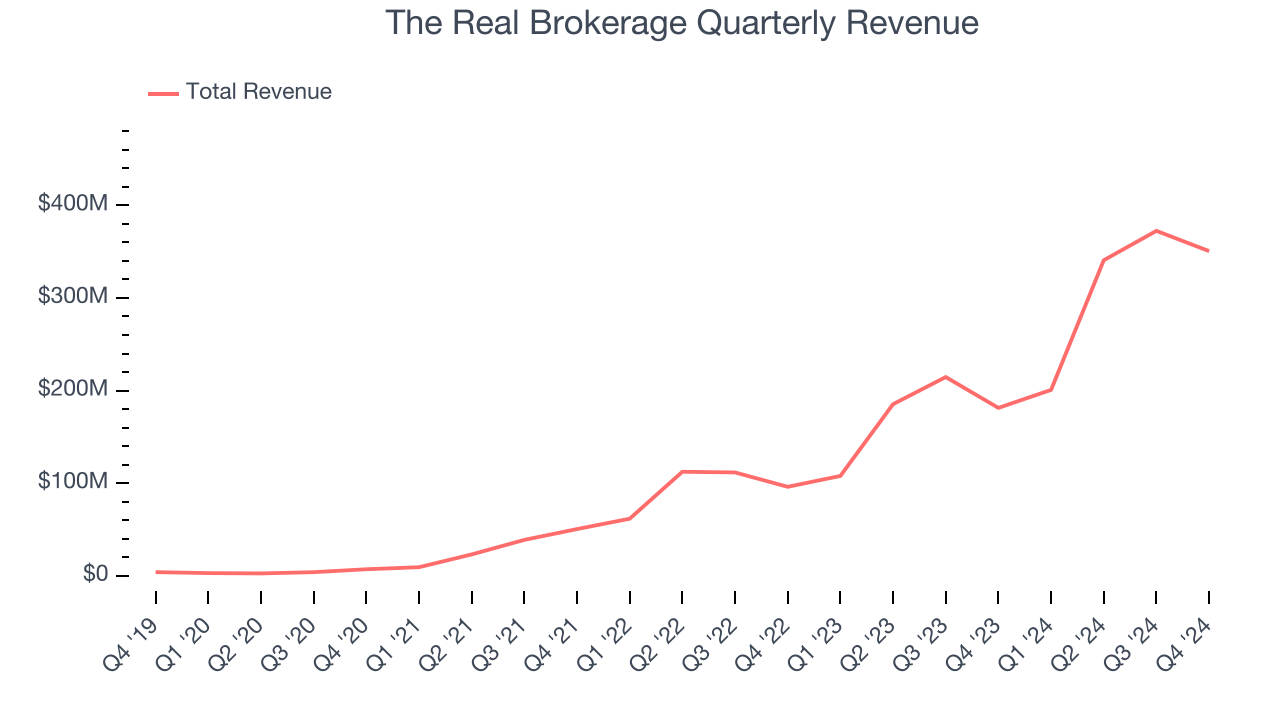
We at StockStory place the most emphasis on long-term growth, but within consumer discretionary, a stretched historical view may miss a company riding a successful new product or trend. The Real Brokerage’s annualized revenue growth of 82% over the last two years is below its five-year trend, but we still think the results were good and suggest demand was healthy. 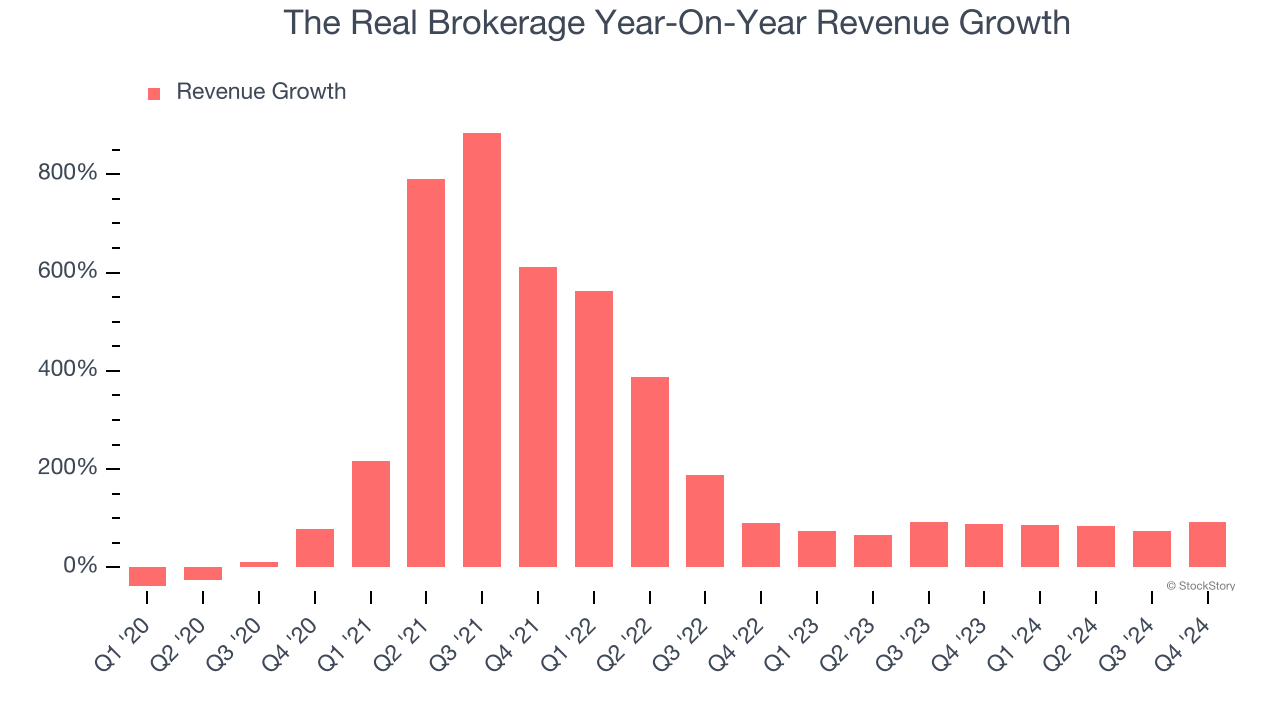
This quarter, The Real Brokerage reported magnificent year-on-year revenue growth of 93.4%, and its $350.6 million of revenue beat Wall Street’s estimates by 16.8%.
Looking ahead, sell-side analysts expect revenue to grow 24.4% over the next 12 months, a deceleration versus the last two years. Despite the slowdown, this projection is noteworthy and implies the market sees success for its products and services.
Here at StockStory, we certainly understand the potential of thematic investing. Diverse winners from Microsoft (MSFT) to Alphabet (GOOG), Coca-Cola (KO) to Monster Beverage (MNST) could all have been identified as promising growth stories with a megatrend driving the growth. So, in that spirit, we’ve identified a relatively under-the-radar profitable growth stock benefiting from the rise of AI, available to you FREE via this link.
Operating Margin
Operating margin is a key measure of profitability. Think of it as net income - the bottom line - excluding the impact of taxes and interest on debt, which are less connected to business fundamentals.
The Real Brokerage’s operating margin has risen over the last 12 months, but it still averaged negative 2.1% over the last two years. This is due to its large expense base and inefficient cost structure.
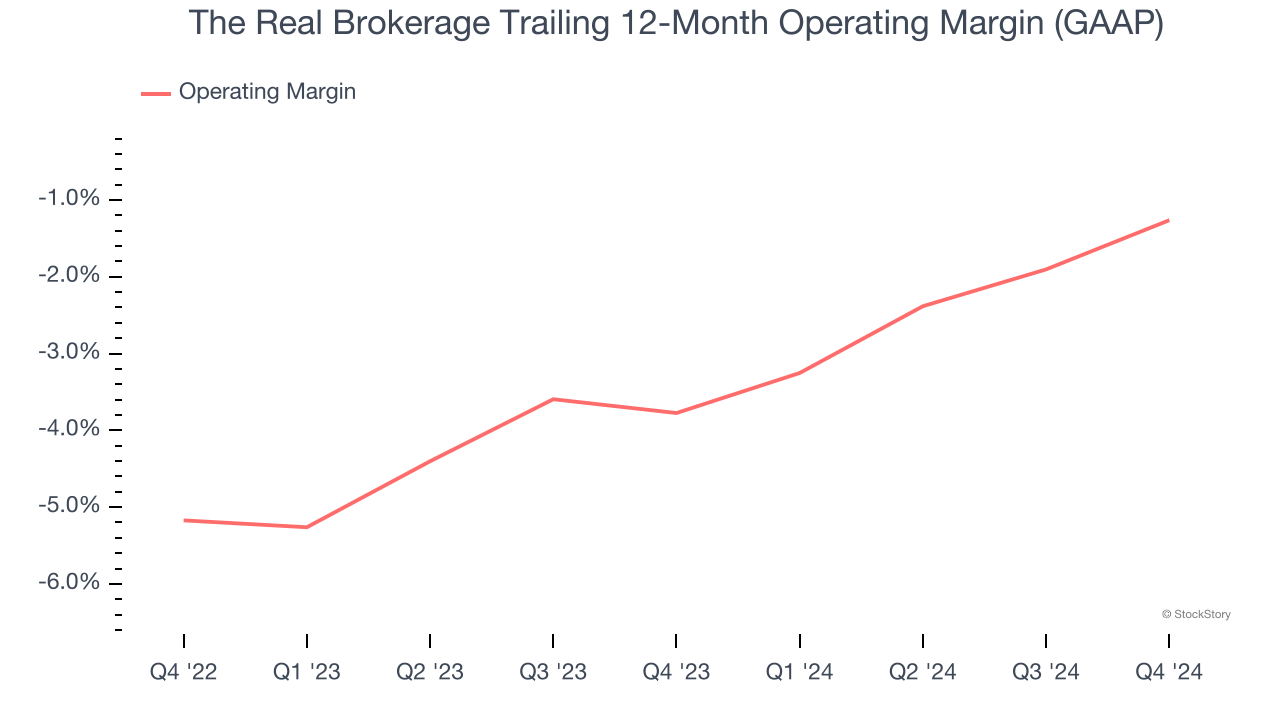
In Q4, The Real Brokerage generated a negative 1.8% operating margin. The company's consistent lack of profits raise a flag.
Earnings Per Share
We track the long-term change in earnings per share (EPS) for the same reason as long-term revenue growth. Compared to revenue, however, EPS highlights whether a company’s growth is profitable.
The Real Brokerage’s earnings losses deepened over the last five years as its EPS dropped 3.8% annually. We tend to steer our readers away from companies with falling EPS, where diminishing earnings could imply changing secular trends and preferences. Consumer Discretionary companies are particularly exposed to this, and if the tide turns unexpectedly, The Real Brokerage’s low margin of safety could leave its stock price susceptible to large downswings.
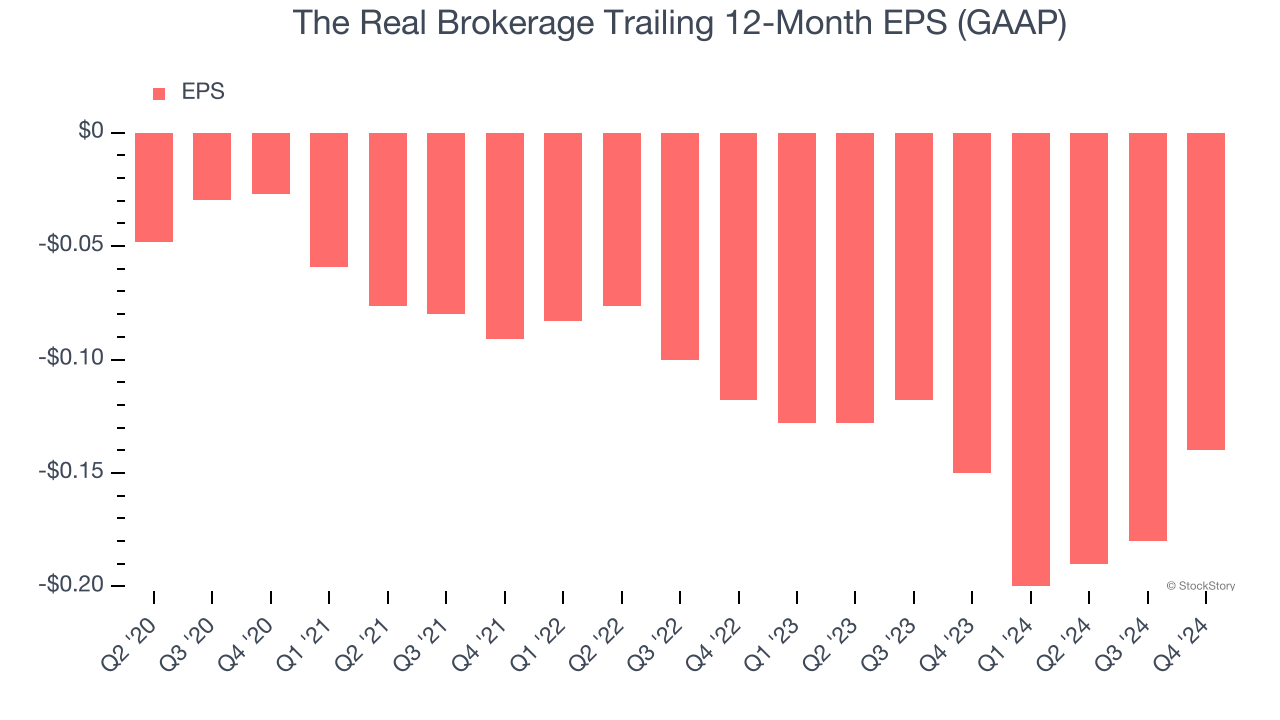
In Q4, The Real Brokerage reported EPS at negative $0.03, up from negative $0.07 in the same quarter last year. This print easily cleared analysts’ estimates, and shareholders should be content with the results. Over the next 12 months, Wall Street is optimistic. Analysts forecast The Real Brokerage’s full-year EPS of negative $0.14 will reach break even.
Key Takeaways from The Real Brokerage’s Q4 Results
We were impressed by how significantly The Real Brokerage blew past analysts’ EPS expectations this quarter. We were also excited its EBITDA outperformed Wall Street’s estimates by a wide margin. Zooming out, we think this was a good quarter with some key areas of upside. The stock traded up 8% to $5.35 immediately following the results.
Indeed, The Real Brokerage had a rock-solid quarterly earnings result, but is this stock a good investment here? What happened in the latest quarter matters, but not as much as longer-term business quality and valuation, when deciding whether to invest in this stock. We cover that in our actionable full research report which you can read here, it’s free.