
Shareholders of Jack in the Box would probably like to forget the past six months even happened. The stock dropped 41.8% and now trades at $27.19. This might have investors contemplating their next move.
Is now the time to buy Jack in the Box, or should you be careful about including it in your portfolio? Dive into our full research report to see our analyst team’s opinion, it’s free.
Even though the stock has become cheaper, we're cautious about Jack in the Box. Here are three reasons why we avoid JACK and a stock we'd rather own.
Why Is Jack in the Box Not Exciting?
Delighting customers since its inception in 1951, Jack in the Box (NASDAQ: JACK) is a distinctive fast-food chain known for its bold flavors, innovative menu items, and quirky marketing.
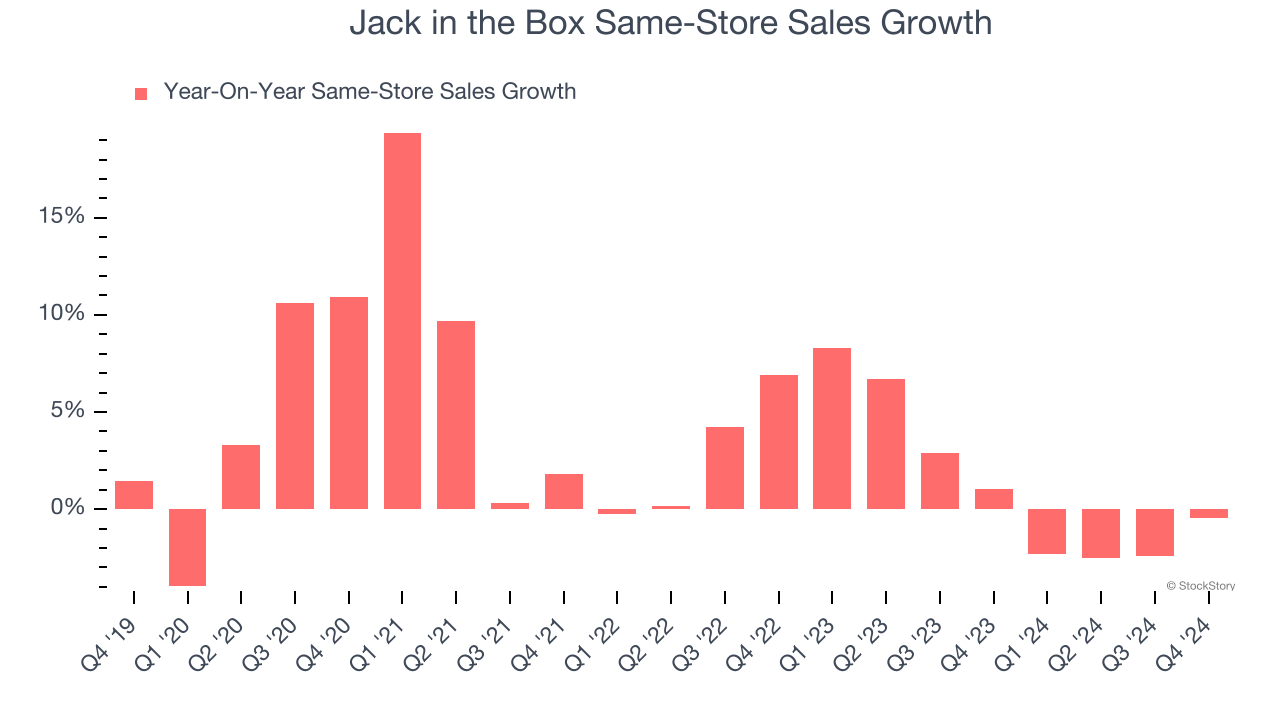
1. Same-Store Sales Falling Behind Peers
Same-store sales is a key performance indicator used to measure organic growth at restaurants open for at least a year.
Jack in the Box’s demand within its existing dining locations has been relatively stable over the last two years but was below most restaurant chains. On average, the company’s same-store sales have grown by 1.4% per year.
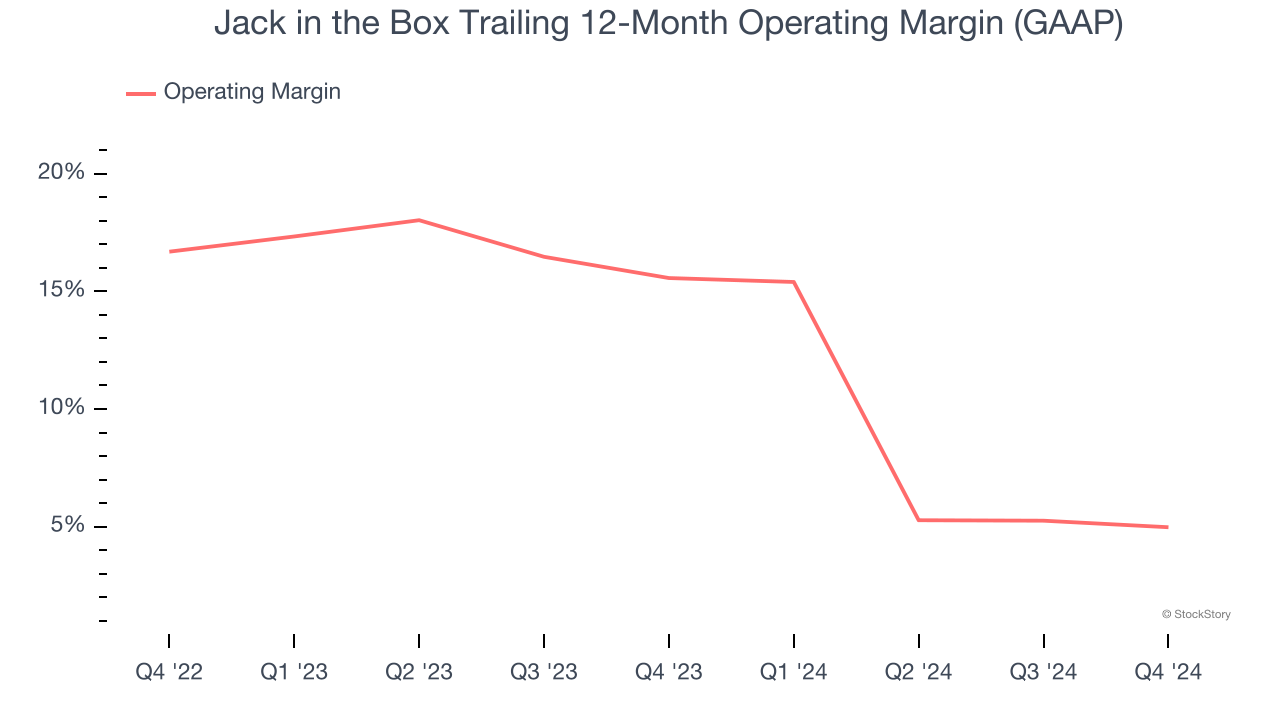
2. Shrinking Operating Margin
Operating margin is an important measure of profitability for restaurants as it accounts for all expenses keeping the business in motion, including food costs, wages, rent, advertising, and other administrative costs.
Analyzing the trend in its profitability, Jack in the Box’s operating margin decreased by 10.6 percentage points over the last year. This raises questions about the company’s expense base because its revenue growth should have given it leverage on its fixed costs, resulting in better economies of scale and profitability. Its operating margin for the trailing 12 months was 5%.
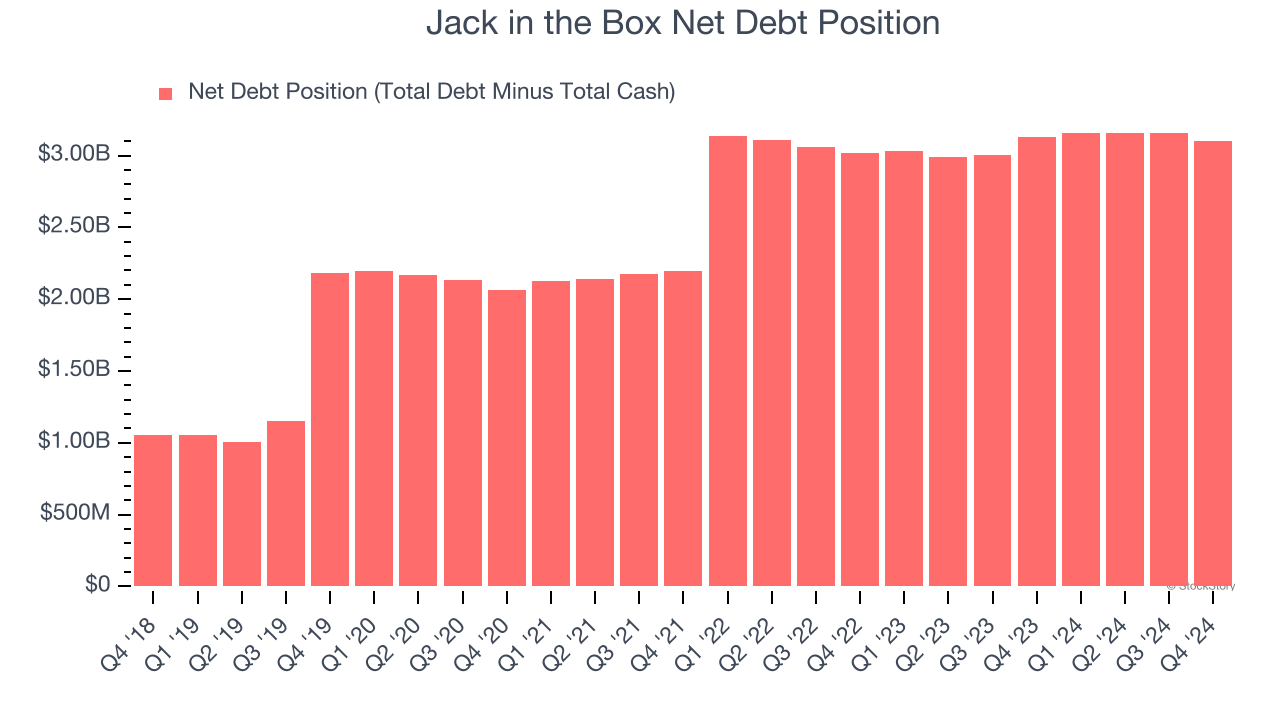
3. High Debt Levels Increase Risk
As long-term investors, the risk we care about most is the permanent loss of capital, which can happen when a company goes bankrupt or raises money from a disadvantaged position. This is separate from short-term stock price volatility, something we are much less bothered by.
Jack in the Box’s $3.17 billion of debt exceeds the $74.98 million of cash on its balance sheet. Furthermore, its 10× net-debt-to-EBITDA ratio (based on its EBITDA of $317.4 million over the last 12 months) shows the company is overleveraged.
At this level of debt, incremental borrowing becomes increasingly expensive and credit agencies could downgrade the company’s rating if profitability falls. Jack in the Box could also be backed into a corner if the market turns unexpectedly – a situation we seek to avoid as investors in high-quality companies.
We hope Jack in the Box can improve its balance sheet and remain cautious until it increases its profitability or pays down its debt.
Final Judgment
Jack in the Box isn’t a terrible business, but it doesn’t pass our quality test. After the recent drawdown, the stock trades at 5× forward price-to-earnings (or $27.19 per share). While this valuation is optically cheap, the potential downside is big given its shaky fundamentals. We're fairly confident there are better investments elsewhere. We’d suggest looking at a safe-and-steady industrials business benefiting from an upgrade cycle.
Stocks We Would Buy Instead of Jack in the Box
The elections are now behind us. With rates dropping and inflation cooling, many analysts expect a breakout market - and we’re zeroing in on the stocks that could benefit immensely.
Take advantage of the rebound by checking out our Top 9 Market-Beating Stocks. This is a curated list of our High Quality stocks that have generated a market-beating return of 175% over the last five years.
Stocks that made our list in 2019 include now familiar names such as Nvidia (+2,183% between December 2019 and December 2024) as well as under-the-radar businesses like Comfort Systems (+751% five-year return). Find your next big winner with StockStory today for free.


