
Since October 2024, Rush Enterprises has been in a holding pattern, posting a small return of 2% while floating around $52.96.
Is now the time to buy Rush Enterprises, or should you be careful about including it in your portfolio? Check out our in-depth research report to see what our analysts have to say, it’s free.
We're cautious about Rush Enterprises. Here are three reasons why we avoid RUSHA and a stock we'd rather own.
Why Do We Think Rush Enterprises Will Underperform?
Headquartered in Texas, Rush Enterprises (NASDAQ: RUSH.A) provides truck-related services and solutions, including sales, leasing, parts, and maintenance for commercial vehicles.
1. Long-Term Revenue Growth Disappoints
Examining a company’s long-term performance can provide clues about its quality. Even a bad business can shine for one or two quarters, but a top-tier one grows for years. Over the last five years, Rush Enterprises grew its sales at a mediocre 6.1% compounded annual growth rate. This fell short of our benchmark for the industrials sector. 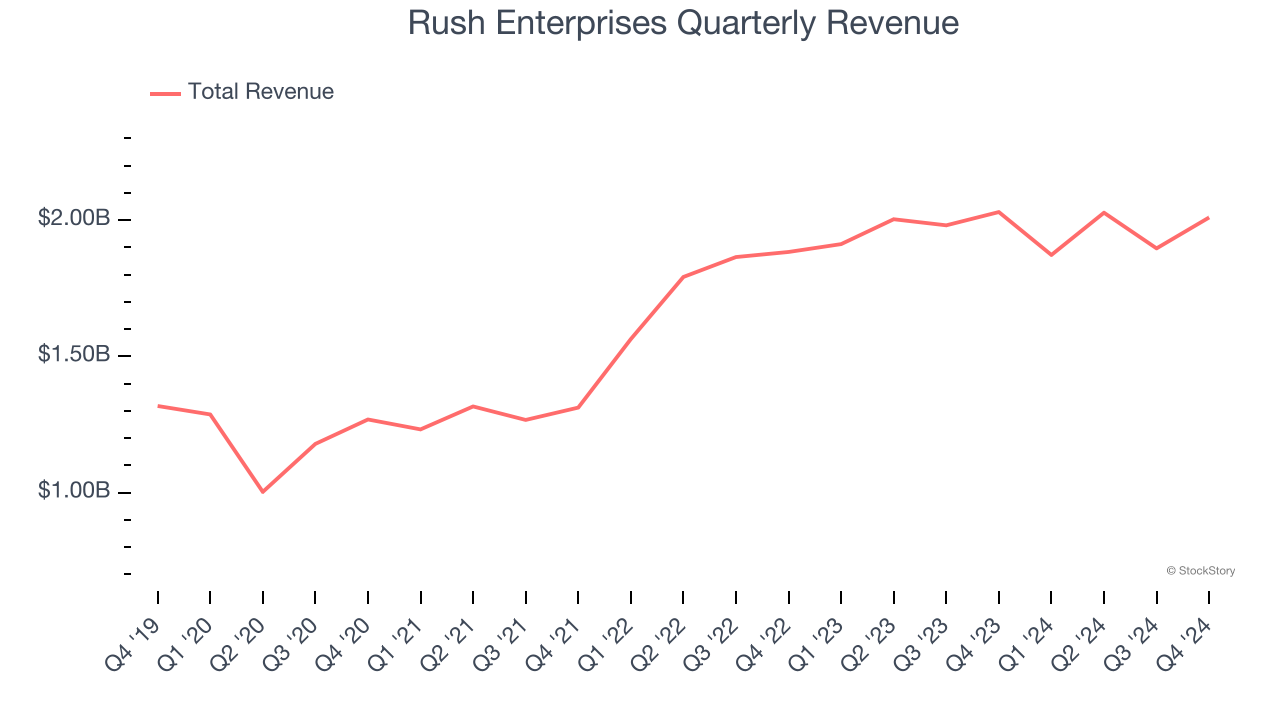
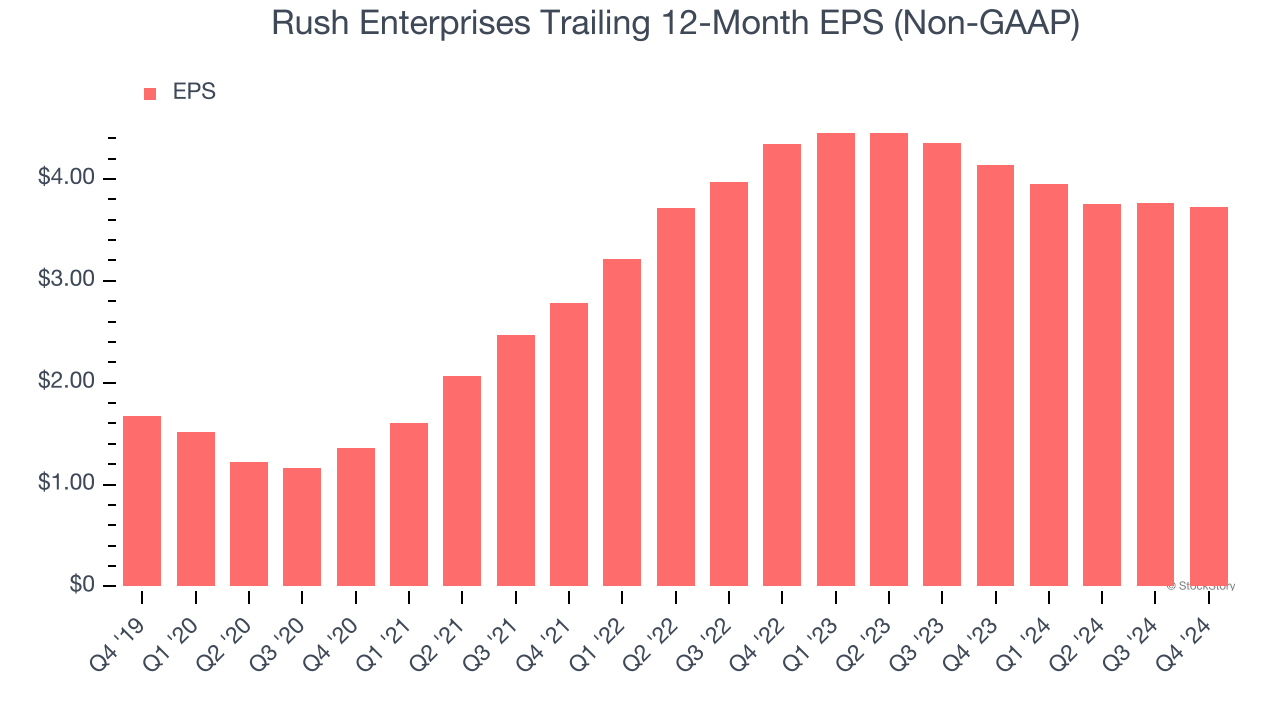
2. EPS Took a Dip Over the Last Two Years
Although long-term earnings trends give us the big picture, we like to analyze EPS over a shorter period to see if we are missing a change in the business.
Sadly for Rush Enterprises, its EPS declined by 7.4% annually over the last two years while its revenue grew by 4.8%. This tells us the company became less profitable on a per-share basis as it expanded.
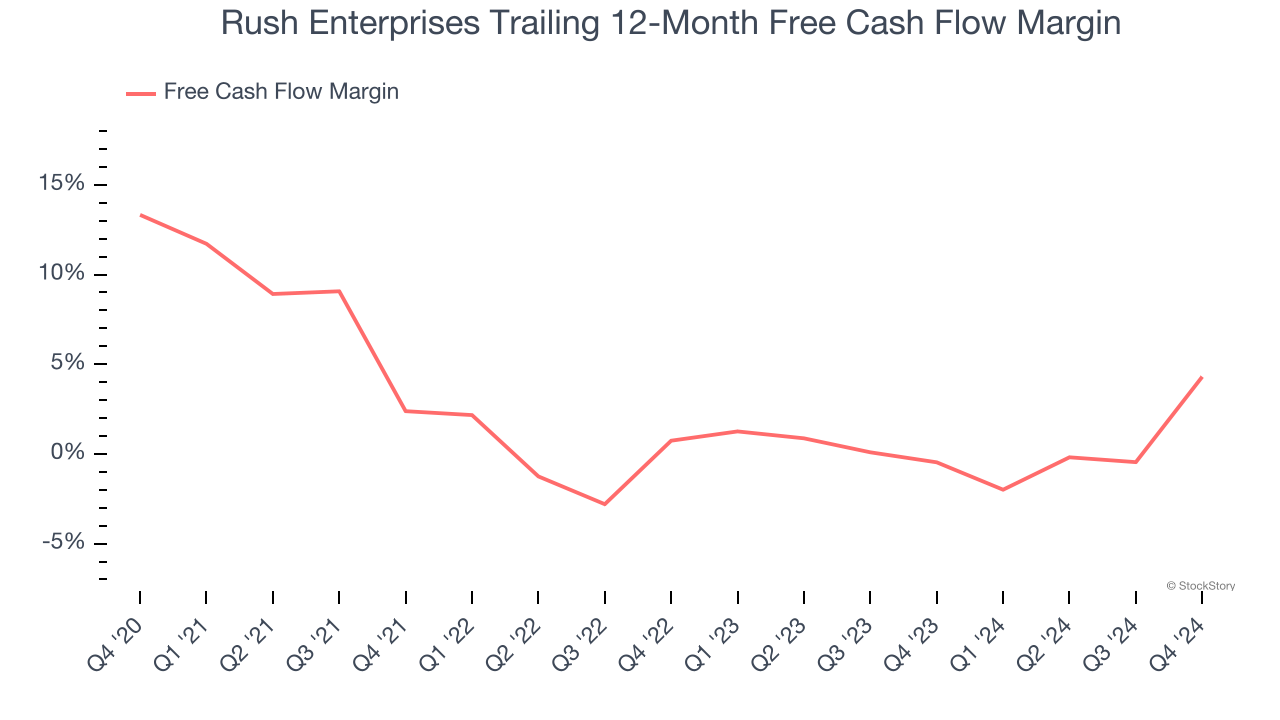
3. Free Cash Flow Margin Dropping
Free cash flow isn't a prominently featured metric in company financials and earnings releases, but we think it's telling because it accounts for all operating and capital expenses, making it tough to manipulate. Cash is king.
As you can see below, Rush Enterprises’s margin dropped by 9 percentage points over the last five years. It may have ticked higher more recently, but shareholders are likely hoping for its margin to at least revert to its historical level. Almost any movement in the wrong direction is undesirable because of its relatively low cash conversion. If the longer-term trend returns, it could signal it’s becoming a more capital-intensive business. Rush Enterprises’s free cash flow margin for the trailing 12 months was 4.3%.
Final Judgment
Rush Enterprises falls short of our quality standards. That said, the stock currently trades at 13.8× forward price-to-earnings (or $52.96 per share). This valuation multiple is fair, but we don’t have much confidence in the company. There are better stocks to buy right now. Let us point you toward the Amazon and PayPal of Latin America.
Stocks We Would Buy Instead of Rush Enterprises
The elections are now behind us. With rates dropping and inflation cooling, many analysts expect a breakout market - and we’re zeroing in on the stocks that could benefit immensely.
Take advantage of the rebound by checking out our Top 9 Market-Beating Stocks. This is a curated list of our High Quality stocks that have generated a market-beating return of 175% over the last five years.
Stocks that made our list in 2019 include now familiar names such as Nvidia (+2,183% between December 2019 and December 2024) as well as under-the-radar businesses like Comfort Systems (+751% five-year return). Find your next big winner with StockStory today for free.


