L.B. Foster has been treading water for the past six months, recording a small return of 2.6% while holding steady at $19.53. However, the stock is beating the S&P 500’s 7.7% decline during that period.
Is there a buying opportunity in L.B. Foster, or does it present a risk to your portfolio? Get the full stock story straight from our expert analysts, it’s free.
Even with the strong relative performance, we're sitting this one out for now. Here are three reasons why we avoid FSTR and a stock we'd rather own.
Why Do We Think L.B. Foster Will Underperform?
Founded with a $2,500 loan, L.B. Foster (NASDAQ: FSTR) is a provider of products and services for the transportation and energy infrastructure sectors, including rail products, construction materials, and coating solutions.
1. Revenue Spiraling Downwards
A company’s long-term performance is an indicator of its overall quality. Even a bad business can shine for one or two quarters, but a top-tier one grows for years. Over the last five years, L.B. Foster’s demand was weak and its revenue declined by 1.5% per year. This was below our standards and is a sign of poor business quality. 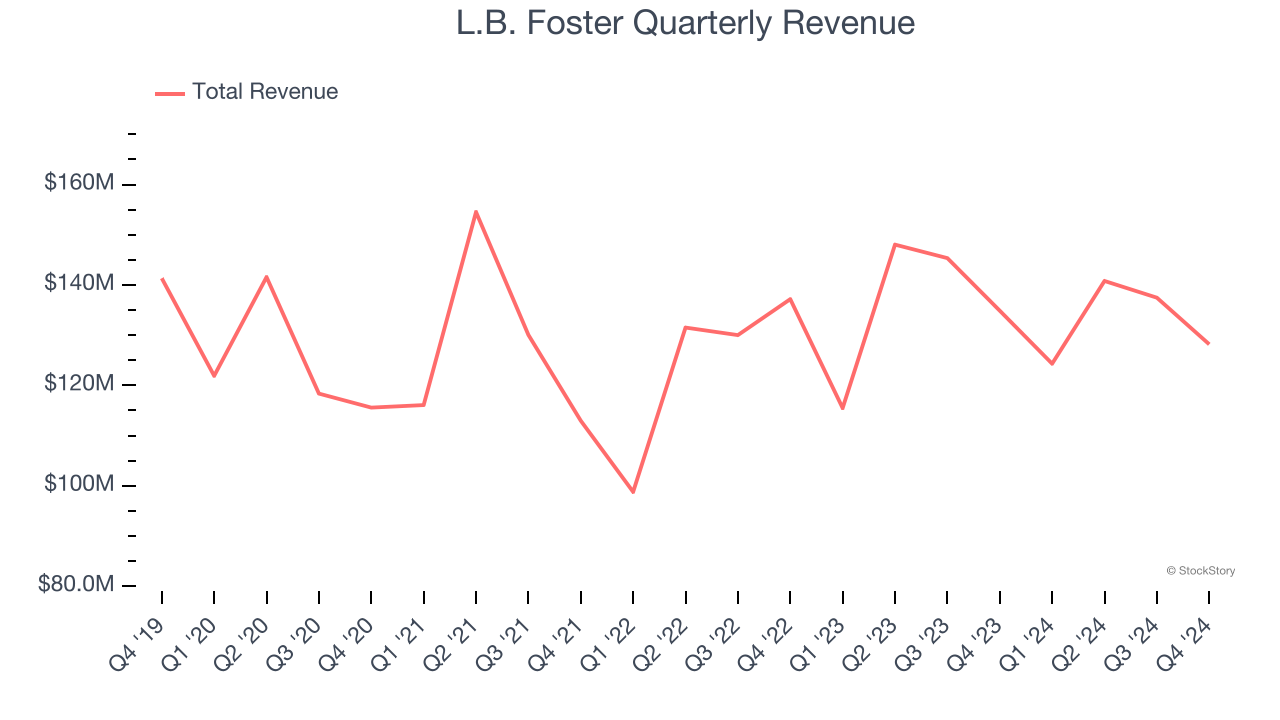
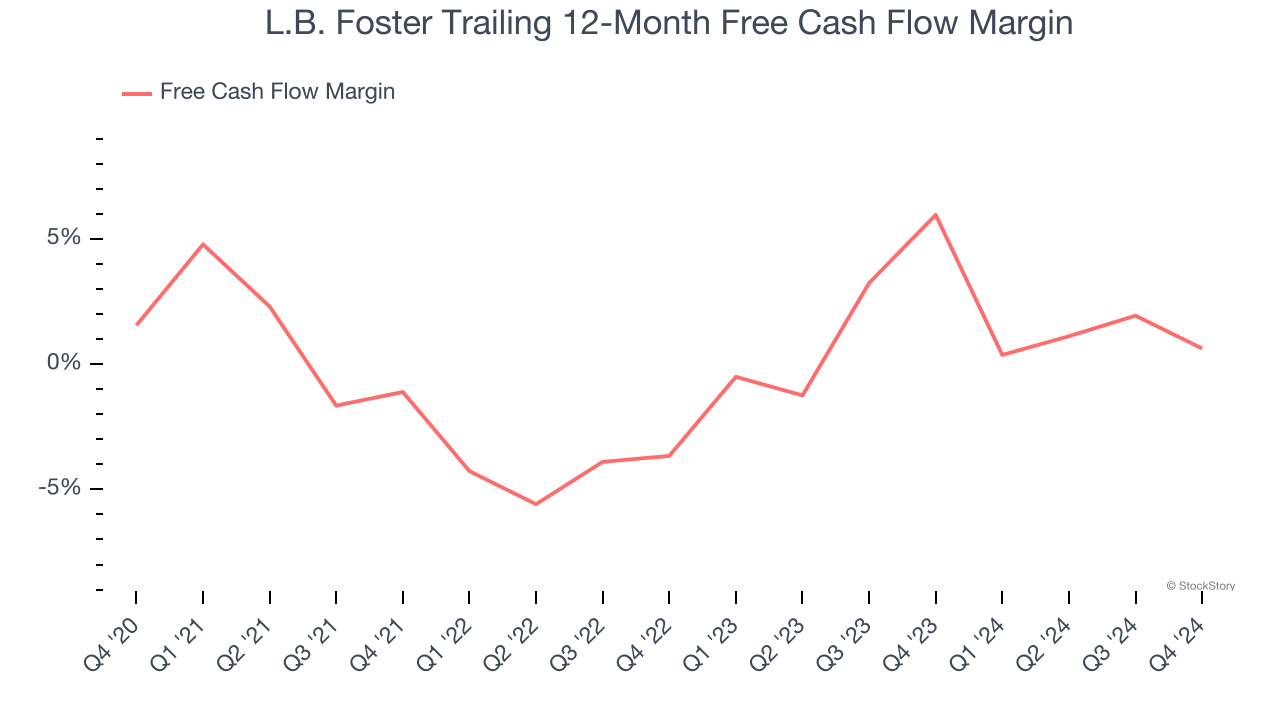
2. Breakeven Free Cash Flow Limits Reinvestment Potential
If you’ve followed StockStory for a while, you know we emphasize free cash flow. Why, you ask? We believe that in the end, cash is king, and you can’t use accounting profits to pay the bills.
L.B. Foster broke even from a free cash flow perspective over the last five years, giving the company limited opportunities to return capital to shareholders.
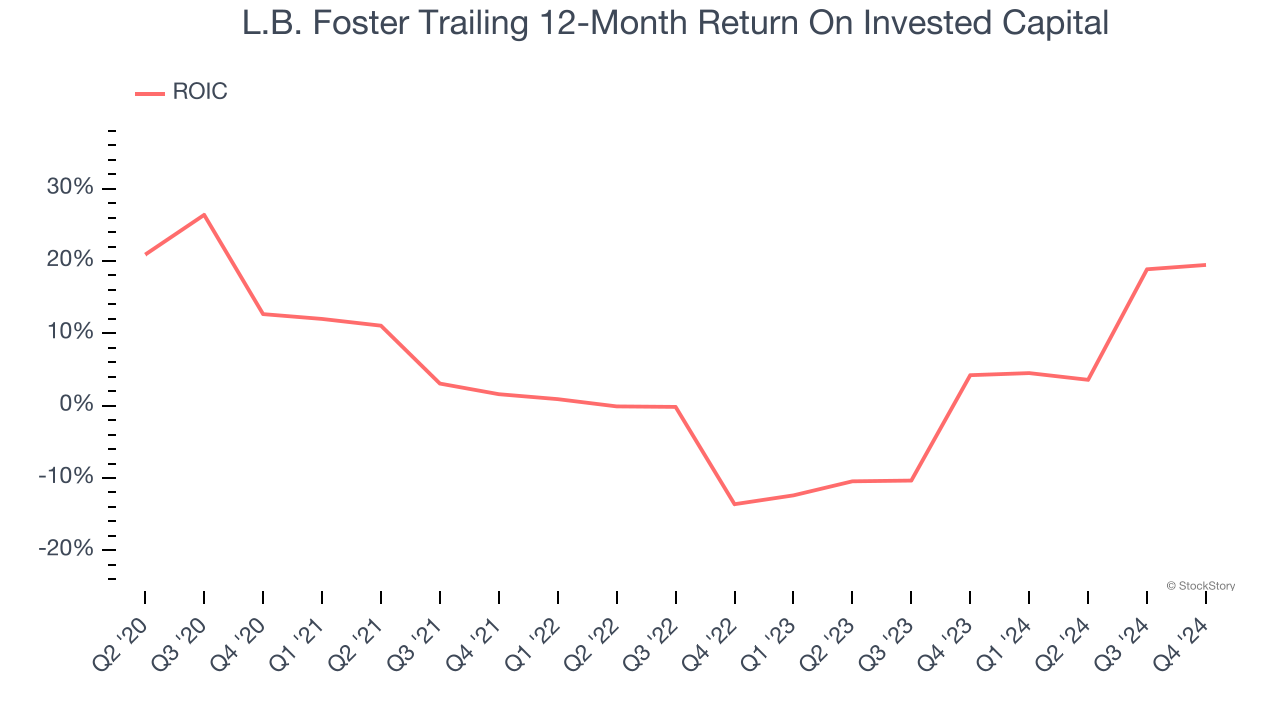
3. Previous Growth Initiatives Haven’t Impressed
Growth gives us insight into a company’s long-term potential, but how capital-efficient was that growth? A company’s ROIC explains this by showing how much operating profit it makes compared to the money it has raised (debt and equity).
L.B. Foster historically did a mediocre job investing in profitable growth initiatives. Its five-year average ROIC was 4.9%, lower than the typical cost of capital (how much it costs to raise money) for industrials companies.
Final Judgment
We see the value of companies helping their customers, but in the case of L.B. Foster, we’re out. Following its recent outperformance amid a softer market environment, the stock trades at 4.8× forward EV-to-EBITDA (or $19.53 per share). While this valuation is reasonable, we don’t see a big opportunity at the moment. There are better investments elsewhere. We’d suggest looking at one of our all-time favorite software stocks.
Stocks We Would Buy Instead of L.B. Foster
The market surged in 2024 and reached record highs after Donald Trump’s presidential victory in November, but questions about new economic policies are adding much uncertainty for 2025.
While the crowd speculates what might happen next, we’re homing in on the companies that can succeed regardless of the political or macroeconomic environment. Put yourself in the driver’s seat and build a durable portfolio by checking out our Top 6 Stocks for this week. This is a curated list of our High Quality stocks that have generated a market-beating return of 175% over the last five years.
Stocks that made our list in 2019 include now familiar names such as Nvidia (+2,183% between December 2019 and December 2024) as well as under-the-radar businesses like Comfort Systems (+751% five-year return). Find your next big winner with StockStory today for free.