Global Business Travel trades at $6.75 per share and has stayed right on track with the overall market, losing 9.5% over the last six months while the S&P 500 is down 7.7%. This might have investors contemplating their next move.
Is there a buying opportunity in Global Business Travel, or does it present a risk to your portfolio? Get the full breakdown from our expert analysts, it’s free.
Even with the cheaper entry price, we're swiping left on Global Business Travel for now. Here are three reasons why there are better opportunities than GBTG and a stock we'd rather own.
Why Is Global Business Travel Not Exciting?
Holding close ties to American Express, Global Business Travel (NYSE: GBTG) is a comprehensive travel and expense management services provider to corporations worldwide.
1. Projected Revenue Growth Is Slim
Forecasted revenues by Wall Street analysts signal a company’s potential. Predictions may not always be accurate, but accelerating growth typically boosts valuation multiples and stock prices while slowing growth does the opposite.
Over the next 12 months, sell-side analysts expect Global Business Travel’s revenue to rise by 4.5%, a deceleration versus its 47% annualized growth for the past three years. This projection is underwhelming and indicates its products and services will face some demand challenges.
2. Low Gross Margin Reveals Weak Structural Profitability
For software companies like Global Business Travel, gross profit tells us how much money remains after paying for the base cost of products and services (typically servers, licenses, and certain personnel). These costs are usually low as a percentage of revenue, explaining why software is more lucrative than other sectors.
Global Business Travel’s gross margin is substantially worse than most software businesses, signaling it has relatively high infrastructure costs compared to asset-lite businesses like ServiceNow. As you can see below, it averaged a 60.1% gross margin over the last year. Said differently, Global Business Travel had to pay a chunky $39.91 to its service providers for every $100 in revenue. 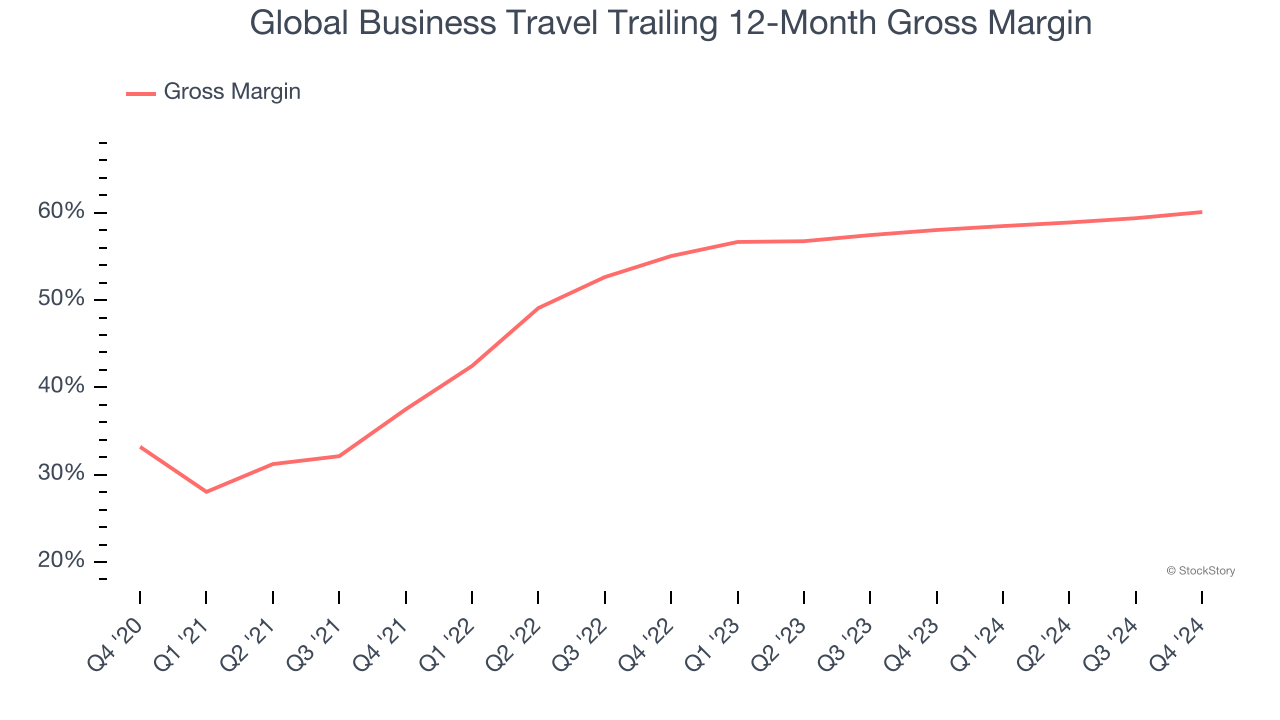
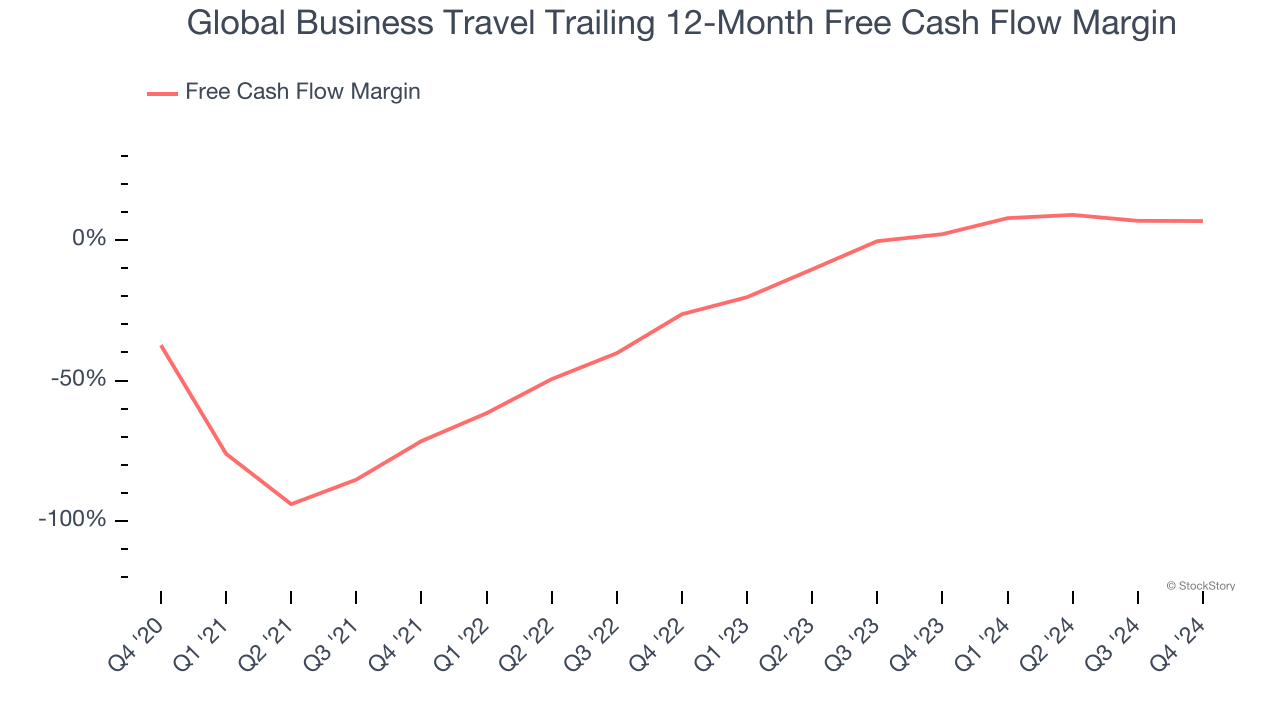
3. Mediocre Free Cash Flow Margin Limits Reinvestment Potential
If you’ve followed StockStory for a while, you know we emphasize free cash flow. Why, you ask? We believe that in the end, cash is king, and you can’t use accounting profits to pay the bills.
Global Business Travel has shown mediocre cash profitability over the last year, giving the company limited opportunities to return capital to shareholders. Its free cash flow margin averaged 6.8%, subpar for a software business.
Final Judgment
Global Business Travel’s business quality ultimately falls short of our standards. After the recent drawdown, the stock trades at 1.2× forward price-to-sales (or $6.75 per share). While this valuation is fair, the upside isn’t great compared to the potential downside. We're fairly confident there are better investments elsewhere. We’d recommend looking at our favorite semiconductor picks and shovels play.
Stocks We Would Buy Instead of Global Business Travel
Market indices reached historic highs following Donald Trump’s presidential victory in November 2024, but the outlook for 2025 is clouded by new trade policies that could impact business confidence and growth.
While this has caused many investors to adopt a "fearful" wait-and-see approach, we’re leaning into our best ideas that can grow regardless of the political or macroeconomic climate. Take advantage of Mr. Market by checking out our Top 9 Market-Beating Stocks. This is a curated list of our High Quality stocks that have generated a market-beating return of 175% over the last five years.
Stocks that made our list in 2019 include now familiar names such as Nvidia (+2,183% between December 2019 and December 2024) as well as under-the-radar businesses like Comfort Systems (+751% five-year return). Find your next big winner with StockStory today for free.