
Restaurant Brands has followed the market’s trajectory closely. The stock is down 12.4% to $61.50 per share over the past six months while the S&P 500 has lost 7.7%. This was partly driven by its softer quarterly results and may have investors wondering how to approach the situation.
Given the weaker price action, is this a buying opportunity for QSR? Find out in our full research report, it’s free.
Why Are We Positive On QSR?
Formed through a strategic merger, Restaurant Brands International (NYSE: QSR) is a multinational corporation that owns three iconic fast-food chains: Burger King, Tim Hortons, and Popeyes.
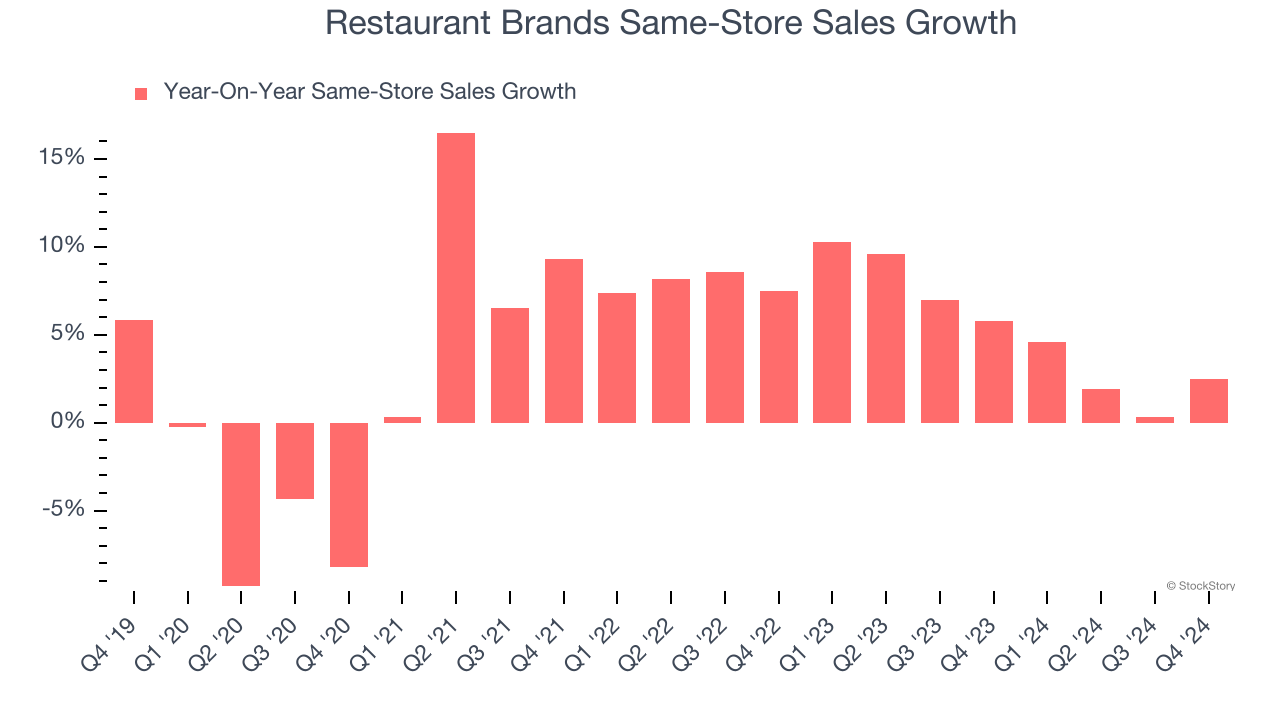
1. Surging Same-Store Sales Show Increasing Demand
Same-store sales is a key performance indicator used to measure organic growth at restaurants open for at least a year.
Restaurant Brands has been one of the most successful restaurant chains over the last two years thanks to skyrocketing demand within its existing dining locations. On average, the company has posted exceptional year-on-year same-store sales growth of 5.3%.
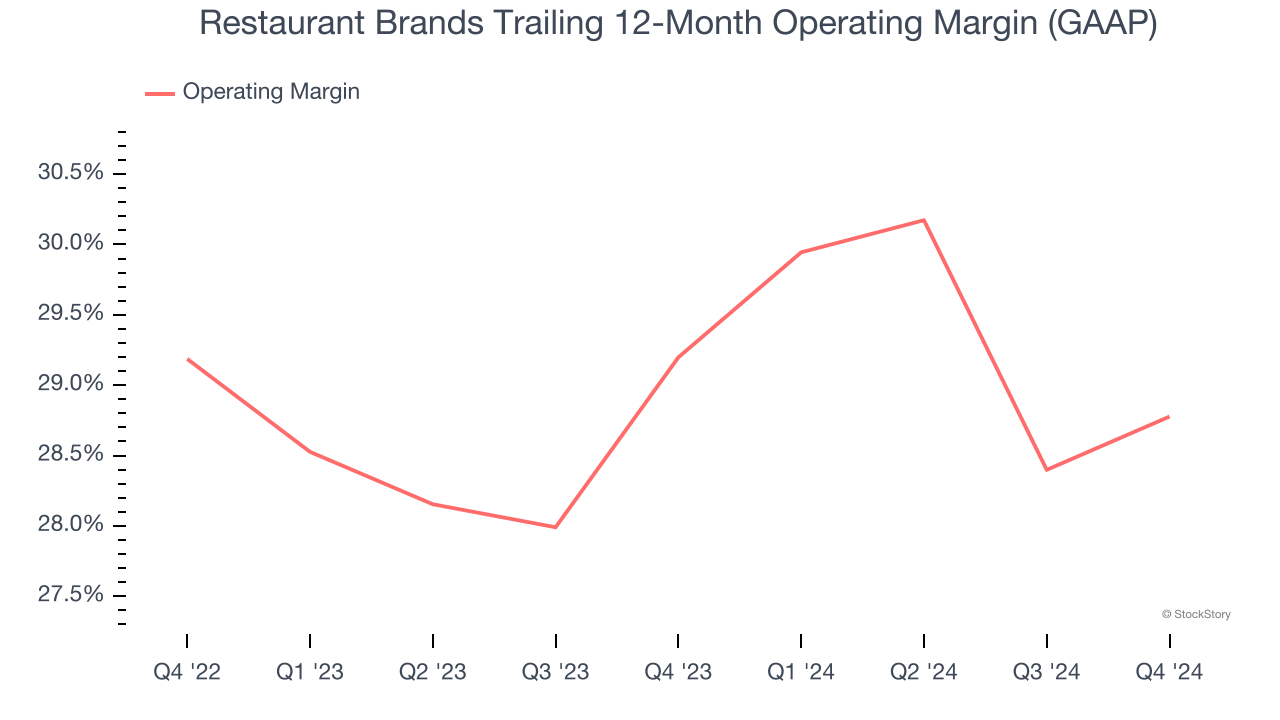
2. Operating Margin Reveals a Well-Run Organization
Operating margin is an important measure of profitability as it shows the portion of revenue left after accounting for all core expenses – everything from the cost of goods sold to advertising and wages. It’s also useful for comparing profitability across companies with different levels of debt and tax rates because it excludes interest and taxes.
Restaurant Brands has been a well-oiled machine over the last two years. It demonstrated elite profitability for a restaurant business, boasting an average operating margin of 29%. This result isn’t surprising as its high gross margin gives it a favorable starting point.
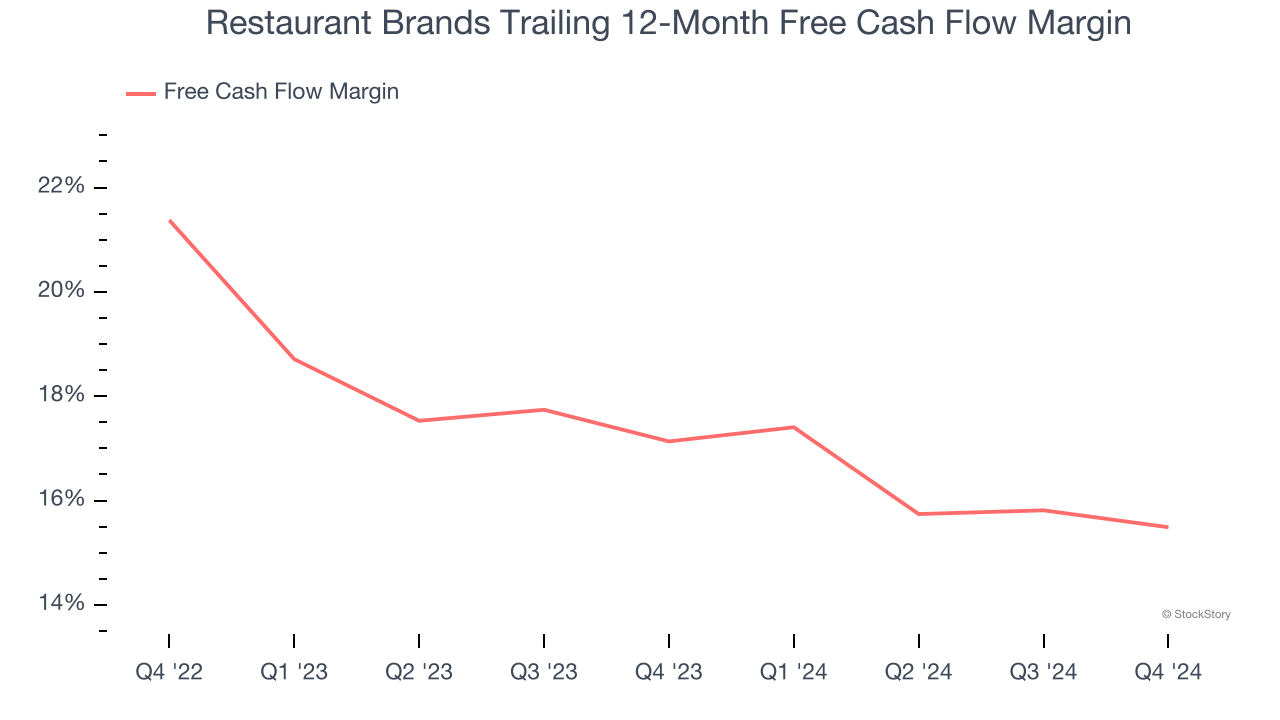
3. Excellent Free Cash Flow Margin Boosts Reinvestment Potential
If you’ve followed StockStory for a while, you know we emphasize free cash flow. Why, you ask? We believe that in the end, cash is king, and you can’t use accounting profits to pay the bills.
Restaurant Brands has shown terrific cash profitability, driven by its lucrative business model that enables it to reinvest, return capital to investors, and stay ahead of the competition. The company’s free cash flow margin was among the best in the restaurant sector, averaging 16.2% over the last two years.
Final Judgment
These are just a few reasons why we're bullish on Restaurant Brands. With the recent decline, the stock trades at 16.7× forward price-to-earnings (or $61.50 per share). Is now the time to initiate a position? See for yourself in our in-depth research report, it’s free.
Stocks We Like Even More Than Restaurant Brands
Market indices reached historic highs following Donald Trump’s presidential victory in November 2024, but the outlook for 2025 is clouded by new trade policies that could impact business confidence and growth.
While this has caused many investors to adopt a "fearful" wait-and-see approach, we’re leaning into our best ideas that can grow regardless of the political or macroeconomic climate. Take advantage of Mr. Market by checking out our Top 6 Stocks for this week. This is a curated list of our High Quality stocks that have generated a market-beating return of 175% over the last five years.
Stocks that made our list in 2019 include now familiar names such as Nvidia (+2,183% between December 2019 and December 2024) as well as under-the-radar businesses like Sterling Infrastructure (+1,096% five-year return). Find your next big winner with StockStory today for free.


