What a time it’s been for Robinhood. In the past six months alone, the company’s stock price has increased by a massive 60%, reaching $40.80 per share. This was partly thanks to its solid quarterly results, and the run-up might have investors contemplating their next move.
Is it too late to buy HOOD? Find out in our full research report, it’s free.
Why Is Robinhood a Good Business?
With a mission to democratize finance, Robinhood (NASDAQ: HOOD) is an online consumer finance platform known for its commission-free stock and crypto trading.
1. Eye-Popping Growth in Customer Spending
Average revenue per user (ARPU) is a critical metric to track because it measures how much the company earns in fees from each user. ARPU also gives us unique insights into the average transaction size on Robinhood’s platform and the company’s take rate, or "cut", on each transaction.
Robinhood’s ARPU growth has been exceptional over the last two years, averaging 43.9%. Its ability to increase monetization while growing its funded customers demonstrates its platform’s value, as its users are spending significantly more than last year. 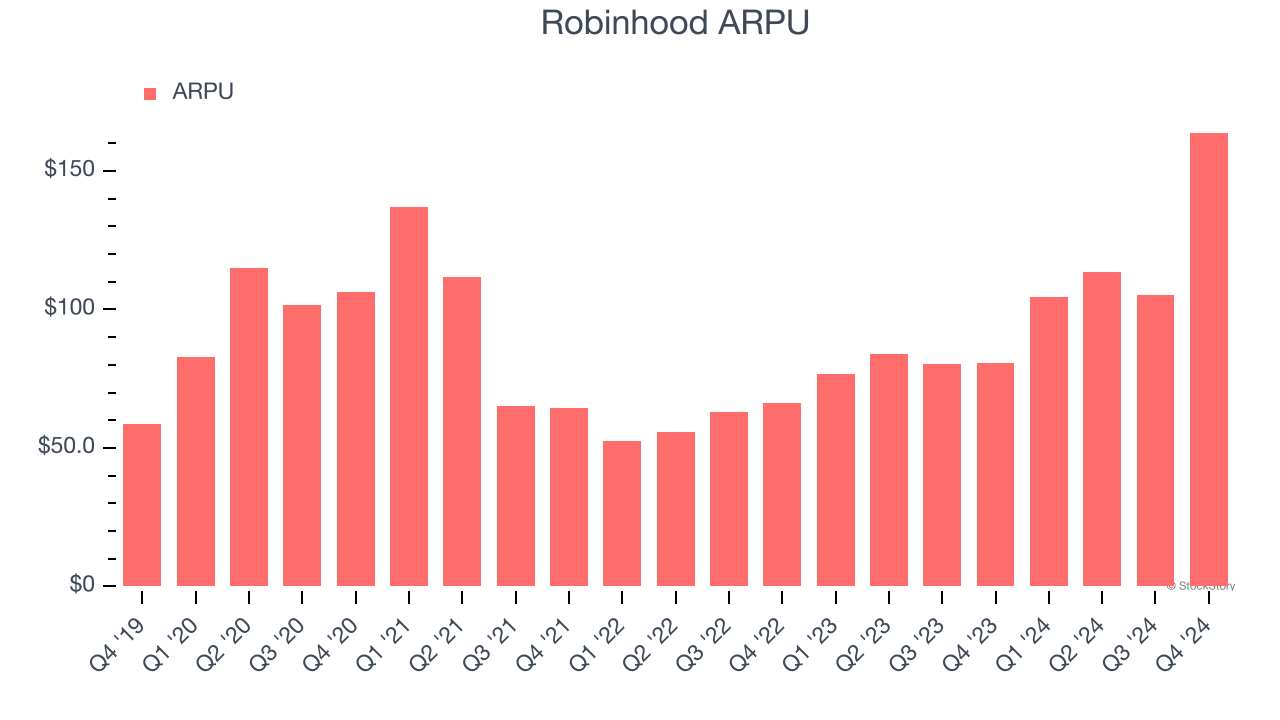
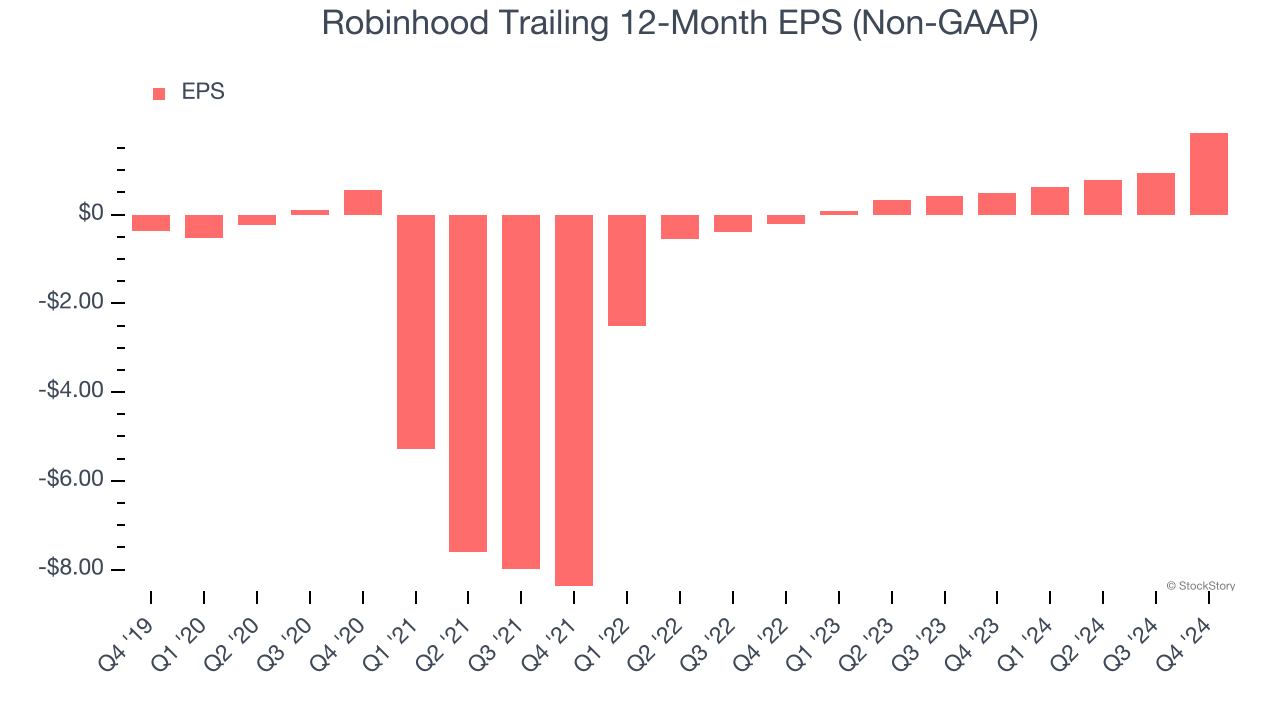
2. Outstanding Long-Term EPS Growth
We track the change in earnings per share (EPS) because it highlights whether a company’s growth is profitable.
Robinhood’s full-year EPS flipped from negative to positive over the last three years. This is a good sign and shows it’s at an inflection point.
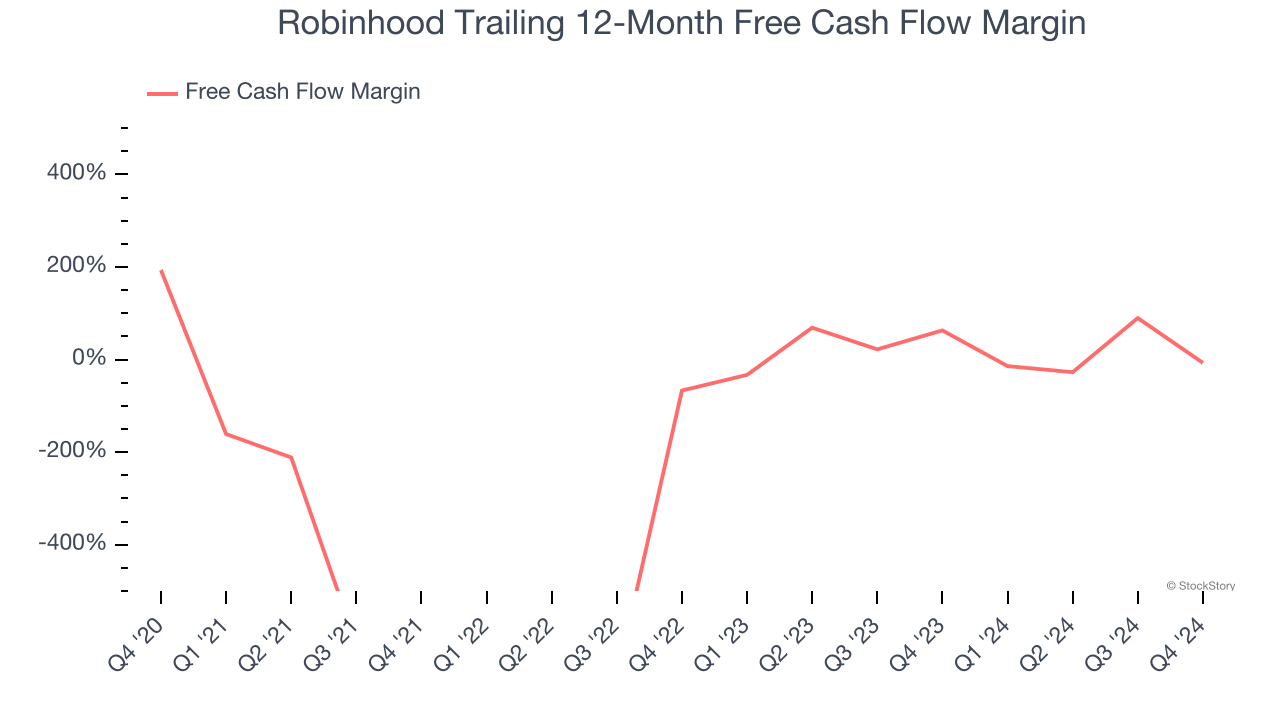
3. Increasing Free Cash Flow Margin Juices Financials
If you’ve followed StockStory for a while, you know we emphasize free cash flow. Why, you ask? We believe that in the end, cash is king, and you can’t use accounting profits to pay the bills.
As you can see below, Robinhood’s margin expanded meaningfully over the last few years. This is encouraging, and we can see it became a less capital-intensive business because its free cash flow profitability rose more than its operating profitability. Robinhood’s free cash flow margin for the trailing 12 months was negative 7.1%.
Final Judgment
These are just a few reasons why we think Robinhood is an elite consumer internet company, and after the recent rally, the stock trades at 22.4× forward EV-to-EBITDA (or $40.80 per share). Is now the time to initiate a position? See for yourself in our comprehensive research report, it’s free.
Stocks We Like Even More Than Robinhood
Market indices reached historic highs following Donald Trump’s presidential victory in November 2024, but the outlook for 2025 is clouded by new trade policies that could impact business confidence and growth.
While this has caused many investors to adopt a "fearful" wait-and-see approach, we’re leaning into our best ideas that can grow regardless of the political or macroeconomic climate. Take advantage of Mr. Market by checking out our Top 6 Stocks for this week. This is a curated list of our High Quality stocks that have generated a market-beating return of 175% over the last five years.
Stocks that made our list in 2019 include now familiar names such as Nvidia (+2,183% between December 2019 and December 2024) as well as under-the-radar businesses like Sterling Infrastructure (+1,096% five-year return). Find your next big winner with StockStory today for free.